Sharing, Collaboration & Alerting
- How to find the owner of an Editable App?
- How to create a copy of an Editable App?
- How to test SMTP mailing account post setup is completed?
- Can we set dynamic email templates to be sent to users basis their roles in case of the occurrence of a specific event?
- Difference between Embedding/Publishing exploration as Remote or Local.
- How to share Exploration with specific Persona?
- How to Configure Dynamic message in Alerts and Triggers?
- How to get live data on the Dashboard?
- How can I take a copy of the Dashboard?
- Can I share Editable App with a Role that I have created?
- How to Schedule an Editable App from Gathr Analytics Home?
- How to schedule an Editable App on the new Gathr Analytics UI?
- How do I schedule an exploration successfully, even though few operations are failing?
- How can I share my account with other users?
- How can I embed my exploration into a website (i.e. confluence, share point)
- How can I set up alerts in my charts?
- How to identify that an Alert is already there on a container or a column?
- Where can I apply Alerts on Gathr Analytics?
In this article
- How to find the owner of an Editable App?
- How to create a copy of an Editable App?
- How to test SMTP mailing account post setup is completed?
- Can we set dynamic email templates to be sent to users basis their roles in case of the occurrence of a specific event?
- Difference between Embedding/Publishing exploration as Remote or Local.
- How to share Exploration with specific Persona?
- How to Configure Dynamic message in Alerts and Triggers?
- How to get live data on the Dashboard?
- How can I take a copy of the Dashboard?
- Can I share Editable App with a Role that I have created?
- How to Schedule an Editable App from Gathr Analytics Home?
- How to schedule an Editable App on the new Gathr Analytics UI?
- How do I schedule an exploration successfully, even though few operations are failing?
- How can I share my account with other users?
- How can I embed my exploration into a website (i.e. confluence, share point)
- How can I set up alerts in my charts?
- How to identify that an Alert is already there on a container or a column?
- Where can I apply Alerts on Gathr Analytics?
How to find the owner of an Editable App?
You can find the owner of the dashboard with the below steps.
- Navigate to Gathr Analytics home
- Click on “Shared with me”
- Click 3 dots menu of the required exploration -> View Details
- You will find the owner of the Editable App as highlighted in the screenshot below.
How to create a copy of an Editable App?
- Copying Editable App in same Gathr Analytics instance. Go to File Menu of the Editable App which you want to Copy and select ‘Create Copy’.
- Copying Editable App in another Gathr Analytics instance. a. Go to File Menu of the Editable App which you want to copy, navigate to ‘Download As’ and select ‘Editable App(.expl)’ b. This downloads the Editable App on your system, and it can be then uploaded from Gathr Analytics home. c. Go to ‘Upload icon’ and select Editable App to browse, and chose Editable App.
How to test SMTP mailing account post setup is completed?
There are multiple ways we can test if a mailing account is configured. We can test it by scheduling the exploration and generating the report for it.
- Create a new exploration.
- Now, let’s create some sample data.
- Go to Templates > Manage. Bring the view on the floor.
- Let’s schedule it. File Menu > Schedule > Editable App.
In the start date-time, choose the nearest time like within next 2-3 mins from your current time.
Go to generate report tab. Checkmark Generate PDF report and Send mail on PDF generation.
In To: field enter the mailing address. In the given case, enter your personal work email address. Click on Add.
On successful schedule of an exploration, you will get a PDF report on your email address. Check your outlook or mailing client.
On successful SMTP configuration, you will get the mail. Alternatively, you must configure with correct details/credentials.
Can we set dynamic email templates to be sent to users basis their roles in case of the occurrence of a specific event?
Yes, we can send emails dynamically to the users when data reaches certain thresholds. Alerts and triggers notify when your data meets certain thresholds or anomalies are detected. Gathr Analytics enables you to set alerts on such critical situations and trigger email to shared users.
- To setup an alert, click on three dots menu of the container -> Add Alert.
- In ‘Create Alert’ form, define conditions on columns and threshold values.
- In next form ‘Add Trigger, select Trigger Type as “Send Email” and configure email Id and the desired content to be shared.
Difference between Embedding/Publishing exploration as Remote or Local.
Embedding exploration as local implies the exploration is being published on the same Gathr Analytics instance. Embedding exploration as remote implies the exploration is being published to a different Gathr Analytics instance. Users must ensure Gathr Analytics version compatibility while publishing to a remote Gathr Analytics instance.
How to share Exploration with specific Persona?
In the new Gathr Analytics UI, there are default roles attached to each Persona.
- For Instance:
- For Author Persona, a system generated role named “AUTHOR” is assigned.
- For App User Persona, a system generated role named “APPUSER” is assigned.
- For Reader Persona, a system generated role named “READER” is assigned.
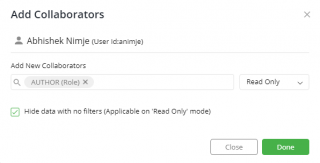
- To share an Exploration with all the users of Author Persona, click on ‘Share editable app’ button at the top of the exploration and search as Author role as shown in the attached image.
How to Configure Dynamic message in Alerts and Triggers?
Please follow the below steps to Configure Dynamic message under Alerts in a container.
- Click on the three dots menu of the Container -> Add Alert
- A form ‘Add Alert’ will pop up to provide Alert name and conditions, fill in the required details, and click Next.
- Under ‘Add Trigger’ form, select ‘Display Message’ in the Trigger Type dropdown.
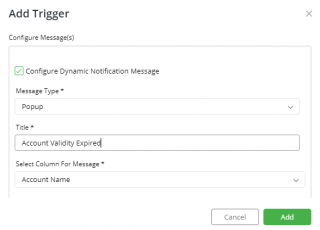
- In configure Message(s) section, select ‘Configure Dynamic Notification Message’. Please provide Message Type, Title, and select a Column from the dropdown to display a Dynamic message on Alert trigger and click Add.
How to get live data on the Dashboard?
We need to re-execute the Dashboard or Container to get live data. Also, we can Schedule the Exploration to run periodically. On every schedule completion, we get live data.
How can I take a copy of the Dashboard?
You can follow any of the below steps to take a copy of the Dashboard.
- Go to File menu –> Download As –> Exploration(.expl)
- Go to File menu –> Save As –> App
- You can save the Exploration as a Template.
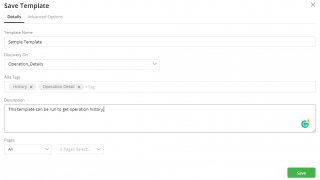
- In the menu bar, click on Templates > New Template.
- A form will pop up on your screen, as shown in the attachment.
- Once you have entered all the details, click ‘Save’.
Can I share Editable App with a Role that I have created?
Yes, you can share the Editable App with roles created. Click on share icon that is visible on top right corner, next to search bar. You can share the Editable App with Read only, Execute only and Full Access. Type in the user role and click on submit. You can also share the Editable App from Gathr Analytics Home. Click on 3 dots of the Editable App you want to share and select add collaborators. Type in the user role and click on submit.
How to Schedule an Editable App from Gathr Analytics Home?
You can now Schedule your Editable App from Gathr Analytics home.
Click on the three-dot menu of the Editable App that requires Scheduling and select “Schedule Job”.
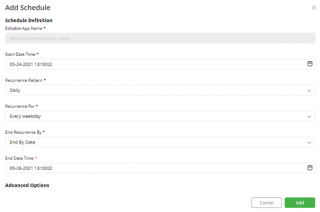
It will open a form to add a Schedule. Please enter below details and click “Add”.
- Start Date Time: Set the start time of your Schedule.
- Recurrence Pattern: How often your background schedule will run i.e. – Only Once, Hourly, Daily, Weekly, etc.; you can select the appropriate option as per your requirement.
- Recurrence For: Every day(s) or Every weekday.
- End Recurrence By: If you select “No End Date” option, then your Schedule will run in the background forever unless you decide to end the schedule. If you select “End by Date” option, then please provide a date when this Schedule will stop running.
Now click on “Schedules” tab, you will be able to see the list of Editable Apps along with Schedules.
To view Schedules of any particular Editable App, click on its three-dot menu>View Schedules.
You will see the list of Schedules for the selected Editable App along with schedule details i.e. – Last run, Next run, Recurrence pattern, Recurrence interval, Successful/Failed runs, etc.
Here, you can also perform actions like – Delete/Disable/Edit/Run the Schedule.

How to schedule an Editable App on the new Gathr Analytics UI?
Please use the following steps to Set-up a Schedule.
Open the exploration which you want a “Schedule” set-up.
Go to File menu and select Schedule>Editable App
You will get a pop window.
There are multiple options that you can use to set up a Schedule.
Start Date Time: Set the start time of your Schedule.
Recurrence Pattern: How often your background Schedule will run i.e. – Only Once, Hourly, Daily, Weekly, etc.; you can select appropriate option as per your requirement.
Recurrence For: Every day(s) or Every weekday.
End Recurrence By: If you select “No End Date” option, then your background Schedule will run forever unless you decide to end the Schedule. If you select “End by Date” option, then please provide a date when this Schedule will stop running.
How do I schedule an exploration successfully, even though few operations are failing?
In the schedule tab, the ‘green’ symbol we see represents “successful exploration execution”. So, in case of exploration execution fails due to some reason, it will show as ‘red’, and its dependent action like (re)publish exploration or report generation will also not be triggered.
For example, if there is no data generated for an operation, it will be declared as a failure. While in some cases this interpretation is relevant, in others it may return failure even if no data found.
To handle such cases, we have provided a feature to ‘show execution result without any error’, where users can define which operation should be interpreted as a failure and which ones should not.
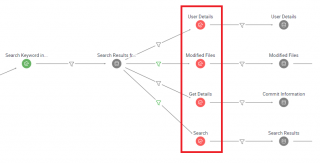
If you check the execution graph, the operations highlighted in the rectangle were shown ‘Red’. This will act as a reference point. Please refer the image
Right click on Floor > Connectors > User Preference > Operation > Preference.
You will get a form, select the connector name from the drop-down. Choose the operation name, in this case, ‘User Details’, checkmark ‘Showed execution error without error’.
Similarly, you can search, and update the remaining 3 fields and hit Submit. Now, schedule the editable app, it will be executed successfully.
How can I share my account with other users?
- Right click on Floor -> Accounts -> Share
- You’ll get a form, please select the account from the Drop down and click on Next.
- Type in the user name, and click on Submit.
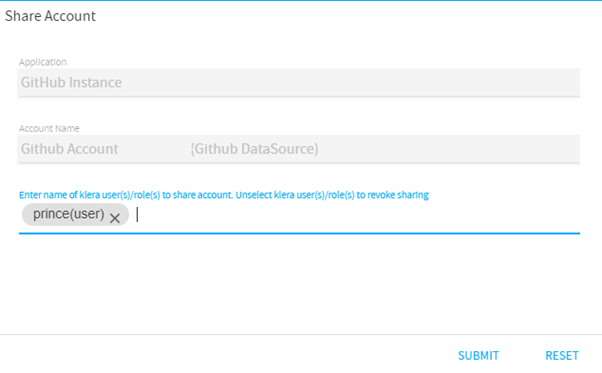
- Once the account is shared to other user, s/he needs to login to Gathr Analytics and click notification on bell icon.
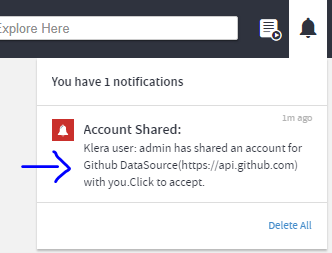
- Please click on notification, you’ll get a form wherein Gathr Analytics will ask consent of user to accept or decline it
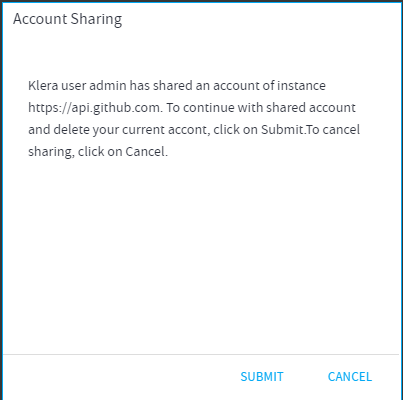
- In the above example, we have shared the GitHub account with a user. Now, he can execute the operations of GitHub without account being configured at his end.
How can I embed my exploration into a website (i.e. confluence, share point)
The explorations can be shared/published on a website through the Publish feature of Gathr Analytics where an HTML Code Snippet (iFrame tag) is generated which can be placed in your website and the exploration will get published there.
- To know more about publishing, Click Here.
How can I set up alerts in my charts?
- Click on 3 vertical dots on the top right corner of the chart container on which you would like to set up an alert and click “Add Alert”.
- Create Alert form will open after clicking on add alert.
- Below are the fields where user can add/select details accordingly.
- Alert Name: Name of the alert
- Alert When: If Any or All conditions are met, then only alert will trigger, and user have an option to select any one condition
- Value of: This specifies the column on which alert is being created
- Is: here user can specify different conditions like, less than, greater than, is equal to, not equal to
- Value: specify the value on which if conditions are met, alert should trigger
- Now click Next.
- This will open Add Trigger form, where user can specify the conditions for an alert to trigger.
- Tigger Name: Name of the trigger
- Trigger Type: If alert conditions are met, how trigger should work. There are different types of trigger conditions which user can select from. For ex, if user wants to Execute Exploration, select Execute Exploration.
- Finally, click on Add this will create alert selected container.
How to identify that an Alert is already there on a container or a column?
An Alert Icon (Bell Icon) will start appearing on the Right Top Corner of Container and at the Right Side of Column Name in Data Panel, under Data Set to represent that Alert has been created on them. If the Alert Icon is YELLOW, that means an Alert has been generated. You can click on that Icon to turn the color from Yellow to GREY to acknowledge that you have noticed that.
Where can I apply Alerts on Gathr Analytics?
Alerts can be applied on:
- Datasets.
- Containers(Columns of Containers).
Gathr Analytics has the capability to generate Alerts and Trigger some Actions automatically, like:
- Send Mail to the stakeholders
- Re-Execute another exploration
Note: Alerts on Containers delete with those containers and of columns with the deletion/purging of data set(s).
To Set an Alert on Datasets:
- Select the Dataset from the Data Panel on the right hand side of the exploration.
- Click on 3 dots and select “Add Alert” option.
- Add the Alert Name and select the condition from the “Alert When” dropdown when the Alert must be triggered.
To Set an Alert on Containers:
- Click on 3 dots on the top right corner of the container and select “Add Alert” option.
- Add the Alert Name and select the conditions from the dropdown on which you want Alert to be triggered and click on “Next” Button.
- Add a Trigger Name and select Trigger Type, Frequency and Editable App Name from the dropdown and click on “Add” Button.
If you have any feedback on Gathr documentation, please email us!