Use Cases
- How to Update Ticket on ServiceNow Tool?
- How to Create Ticket on ServiceNow Tool?
- On running Twitter App I am getting error “access token not found”.
- How to plot Created vs Resolved Issues report on Gathr Analytics on a cumulative basis?
- Can I upload and parse my invoices/ documents on Gathr Analytics?
- How can I manage my accounts payable better with Gathr Analytics?
- How can Basic Users reset their password, via forgot password option?
- How to Edit Athena SQL query and Get Data on existing Container?
- How to Append Unique records in existing dataset through JQL operation?
- How to create dynamic Jira JQL from ReportPortal data?
- How can I navigate to page with a button?
- Can I execute an operation with a Button?
- Can I add a button to re-execute a Dataset?
- Can slicer view filter the data across the multiple dataset?
- How to use regular expression in data scope filter?
- How to separate a multi-valued column to single value?
- How to replace a container when you are executing operation with form operation?
- Can I re-execute Operation in a published Exploration?
- Why other users are unable to see data from my shared Dash Board?
- How to change JQL input of existing Editable App?
- Use Exploration History to identify failure in Exploration.
- Basic Troubleshooting steps if Exploration Execution Failed.
- Basic troubleshooting steps if exploration execution stuck in ‘Waiting for User Input’ status.
- Does Gathr Analytics support AI/ ML algorithms?
- Who are all your clients in the ITES domain?
- Who all are Klera’s Competitors?
- How can Gathr Analytics help Organizations/Teams - in being responsive and proactive to day-today Business challenges?
- How can Gathr Analytics help in monitoring CI/CD Pipeline effectively?
- How to use ARIMA ML Model in Gathr Analytics
- How to mark an operation as a favorite operation?
- Is there an example of a Data Collection use case that can be solved with Gathr Analytics?
- What kind of survey apps can I create on Gathr Analytics?
- Are the survey analytics provided in a standard format?
- Can I create an Enterprise Search app on Gathr Analytics?
- Can Gathr Analytics help me track if my team is adhering to standard processes and policies, and making timely entries and updates?
- What kind of planning apps can I create on Gathr Analytics?
- Can I create a PI Planning app on Gathr Analytics?
- Basic Concepts of Gathr Analytics
- Base Logic before you solve any use case
- How do I setup background schedules?
- I have a dataset with category column and need to extract a unique list of categories. How can I?
- How do I find out the explorations scheduled enterprise wide?
- Where can I find the source of this dataset? Which operation did I run?
- How to understand the order in which operations were executed to fetch the data?
- How to assess which dataset’s field was used to create a formula in one of the dataset (e.g. VLOOKUP, COUNTIF)?
- How can I design dynamic data dropdowns in Forms?
- Can we collect data from users?
- We are looking for an HR Onboarding solution. How can Gathr Analytics help?
- What are the KPIs available on JIRA?
- How do I identify bottlenecks in my JIRA workflow?
- I am looking for an Enterprise search solution to be able to search documents.
- How does Gathr Analytics enable traceability across systems?
- How can I find out the path forward for analysis?
In this article
- How to Update Ticket on ServiceNow Tool?
- How to Create Ticket on ServiceNow Tool?
- On running Twitter App I am getting error “access token not found”.
- How to plot Created vs Resolved Issues report on Gathr Analytics on a cumulative basis?
- Can I upload and parse my invoices/ documents on Gathr Analytics?
- How can I manage my accounts payable better with Gathr Analytics?
- How can Basic Users reset their password, via forgot password option?
- How to Edit Athena SQL query and Get Data on existing Container?
- How to Append Unique records in existing dataset through JQL operation?
- How to create dynamic Jira JQL from ReportPortal data?
- How can I navigate to page with a button?
- Can I execute an operation with a Button?
- Can I add a button to re-execute a Dataset?
- Can slicer view filter the data across the multiple dataset?
- How to use regular expression in data scope filter?
- How to separate a multi-valued column to single value?
- How to replace a container when you are executing operation with form operation?
- Can I re-execute Operation in a published Exploration?
- Why other users are unable to see data from my shared Dash Board?
- How to change JQL input of existing Editable App?
- Use Exploration History to identify failure in Exploration.
- Basic Troubleshooting steps if Exploration Execution Failed.
- Basic troubleshooting steps if exploration execution stuck in ‘Waiting for User Input’ status.
- Does Gathr Analytics support AI/ ML algorithms?
- Who are all your clients in the ITES domain?
- Who all are Klera’s Competitors?
- How can Gathr Analytics help Organizations/Teams - in being responsive and proactive to day-today Business challenges?
- How can Gathr Analytics help in monitoring CI/CD Pipeline effectively?
- How to use ARIMA ML Model in Gathr Analytics
- How to mark an operation as a favorite operation?
- Is there an example of a Data Collection use case that can be solved with Gathr Analytics?
- What kind of survey apps can I create on Gathr Analytics?
- Are the survey analytics provided in a standard format?
- Can I create an Enterprise Search app on Gathr Analytics?
- Can Gathr Analytics help me track if my team is adhering to standard processes and policies, and making timely entries and updates?
- What kind of planning apps can I create on Gathr Analytics?
- Can I create a PI Planning app on Gathr Analytics?
- Basic Concepts of Gathr Analytics
- Base Logic before you solve any use case
- How do I setup background schedules?
- I have a dataset with category column and need to extract a unique list of categories. How can I?
- How do I find out the explorations scheduled enterprise wide?
- Where can I find the source of this dataset? Which operation did I run?
- How to understand the order in which operations were executed to fetch the data?
- How to assess which dataset’s field was used to create a formula in one of the dataset (e.g. VLOOKUP, COUNTIF)?
- How can I design dynamic data dropdowns in Forms?
- Can we collect data from users?
- We are looking for an HR Onboarding solution. How can Gathr Analytics help?
- What are the KPIs available on JIRA?
- How do I identify bottlenecks in my JIRA workflow?
- I am looking for an Enterprise search solution to be able to search documents.
- How does Gathr Analytics enable traceability across systems?
- How can I find out the path forward for analysis?
How to Update Ticket on ServiceNow Tool?
To update ServiceNow Tickets, users need to execute respective operation. Please follow the steps below:
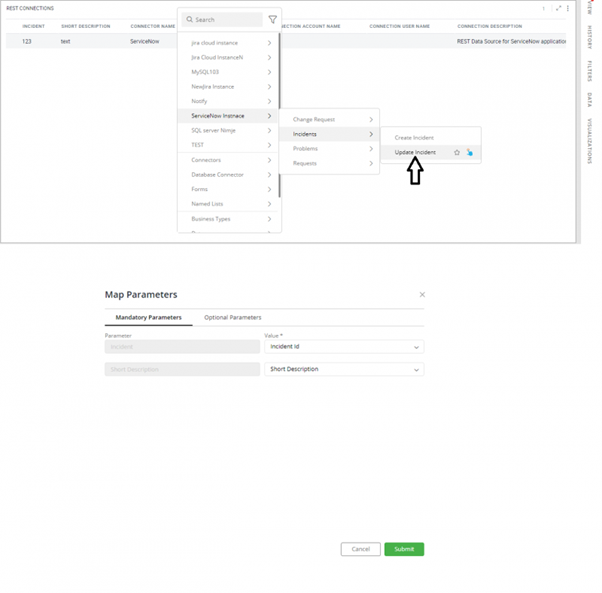
- Right click on the top of the container and navigate to: ‘Your ServiceNow Instance’ → Incidents → Update Incident Click ‘Update Incident’ operation.
- “Reduce Data” popup will appear. Click on ‘Skip’ to get re-directed to the Map Parameters popup.
- In Map Parameters popup, under ‘Mandatory Parameters’ tab, user needs to map the mandatory parameters correspondingly. Under ‘Optional Parameters’ tab, user can map parameters as per his requirements. Click on the ‘+’ icon to add multiple fields to be mapped. Skip ‘optional parameters’, if not required. Please refer the attachment.
- Ticket is updated successfully with this write back feature on ServiceNow on clicking Submit button.
‘Request Execution Detail’ and ‘Updated Incident’ datasets will be created for write back operation.
i. Updated Incident
- This dataset will have all the fields that were used to update tickets. ii. Request Execution Detail
- This dataset will have all the columns of the updated tickets.
How to Create Ticket on ServiceNow Tool?
To create ServiceNow Tickets, users need to execute respective operation. Please follow the steps below:
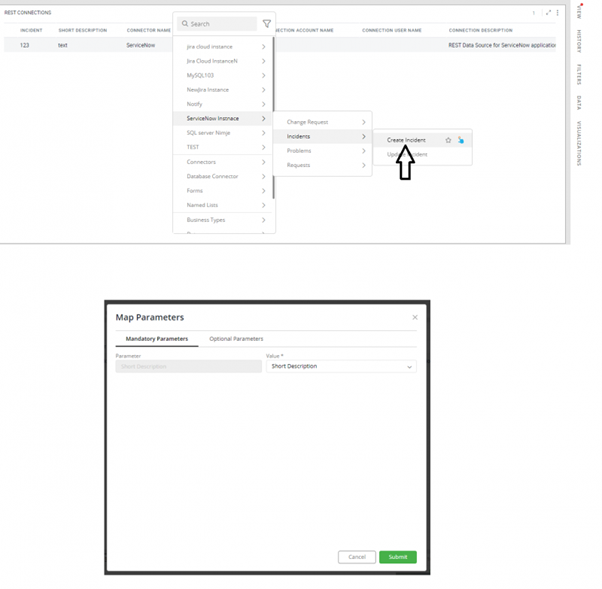
- Right click on the top of the container and navigate to:
- Your ServiceNow Instance- → Incidents → Create Incident
- Click ‘Create Incident’ operation.
- “Reduce Data” popup will appear. Click on ‘Skip’ to get re-directed to the Map Parameters popup.
- In Map Parameters popup, under ‘Mandatory Parameters’ tab, user needs to map the mandatory parameters correspondingly.
- Under ‘Optional Parameters’ tab, user can map parameters as per his requirements.
- Click on the ‘+’ icon to add multiple fields to be mapped.
- Skip ‘optional parameters’, if not required.
Please refer the attachment. 7. Ticket is created successfully with this write back feature on ServiceNow on clicking Submit button. ‘Request Execution Detail’ and ‘Created Incident’ datasets will be created for write back operation. i. Created Incident
- This dataset will have all the fields that were used to create tickets. ii. Request Execution Detail
- This dataset will have all the columns of the created ticket.
On running Twitter App I am getting error “access token not found”.
We get this error message when user is not signed in with his Twitter account on Gathr Analytics. Please sign in with your Twitter account with the below steps.
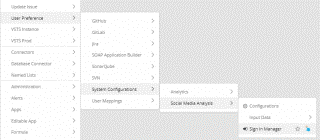
- Right-click on floor–User Preference–System Configurations–Social Media Analysis–Sign In Manager. PFA
- Drag the view on the floor. Right-click on the source ‘Twitter’–User Preference–System Configurations–Social Media Analysis–Sign In.
- It will open a form. Please provide your Twitter account credentials and click Submit.
- Once the sign-in is successful, user can try re-executing the Twitter App.
How to plot Created vs Resolved Issues report on Gathr Analytics on a cumulative basis?
Please follow the below steps to plot Created vs Resolved Issues on a cumulative basis on Gathr Analytics.
- Fetch Jira issues and bring the dataset on Gathr Analytics floor.
- Execute history operation on the required issue keys and drag the view on Gathr Analytics floor.
- Both the datasets “Issues” and “Jira Issues History” have date column “Created”.
To differentiate between the two, let’s create two formula columns:
- Creation Date = Issues.Created in Issues container
- Date = ‘Jira Issue History’.Created in Jira Issues History container
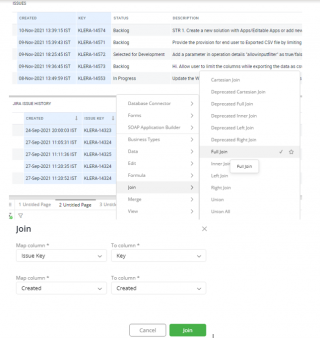
- Select the columns Created, Key, Created, and Issue Key from both the containers as shown in the attached screenshot and perform a full join. Drag the view on Gathr Analytics floor.
- Create a formula column to give every row a value of 1 (e.g. Index = 1)
- Create a formula to make a single issue key column.
- Issue = IF(ISNULL(‘Jira Issue History | Full Join | Issues’.’Issue Key’), ‘Jira Issue History | Full Join | Issues’.Key, ‘Jira Issue History | Full Join | Issues’.’Issue Key’)
- Similarly, create a formula to make a single Date column.
- Date Field = IF(ISNULL(‘Jira Issue History | Full Join | Issues’.Date), ‘Jira Issue History | Full Join | Issues’.’Creation Date’, ‘Jira Issue History | Full Join | Issues’.Date)
- Create a formula column Creation Mark =
- IF(NOTNULL(‘Jira Issue History | Full Join | Issues’.’Creation Date’), “Created”, NULL)
- Create a formula column Resolve Marker = IF(‘Jira Issue History | Full Join | Issues’.’New Value’=”Fixed”, “Resolved”, NULL)
Note: User needs to replace “Fixed” with the terminology they use in their Jira for issue’s status (like Resolved/Done/Fixed)
- Create a formula column to fetch cumulative creations by date.
Cumulative Creations = SUMIFS(‘Jira Issue History | Full Join | Issues’.Index, ‘Jira Issue History | Full Join | Issues’.’Creation Mark’, “=”, “Created”, ‘Jira Issue History | Full Join | Issues’.’Date Field’, “<=", ‘Jira Issue History | Full Join | Issues’.‘Date Field’)
- Create a formula column to fetch cumulative resolutions by date.
Cumulative Resolutions = SUMIFS(‘Jira Issue History | Full Join | Issues’.Index, ‘Jira Issue History | Full Join | Issues’.‘Resolve Marker’, “=”, “Resolved”, ‘Jira Issue History | Full Join | Issues’.‘Date Field’, “<=”, ‘Jira Issue History | Full Join | Issues’.‘Date Field’)
- Plot these the columns Cumulative Creations and Cumulative Resolutions by averaging their column values against the Date Field chart.
Your cumulative chart of creations vs resolutions by date is done
Can I upload and parse my invoices/ documents on Gathr Analytics?
Yes, Gathr Analytics has the ability to upload the csv documents and allow user to visualize the data to get more insights.
Also, Gathr Analytics provides integration with QuickBooks to analyze your business payments, manage and pay your bills, and payroll functions.
We do have following templates to help you get started:
- QuickBooks Purchase Order Analysis
- QuickBooks Customer and Invoice Analysis
- QuickBooks Account Details
How can I manage my accounts payable better with Gathr Analytics?
Gathr Analytics create solutions that deliver intelligence from data. Gathr Analytics also provides integration with QuickBooks to analyze your business payments, manage and pay your bills, and payroll functions.
- QuickBooks Purchase Order Analysis
- QuickBooks Customer and Invoice Analysis
- QuickBooks Account Details
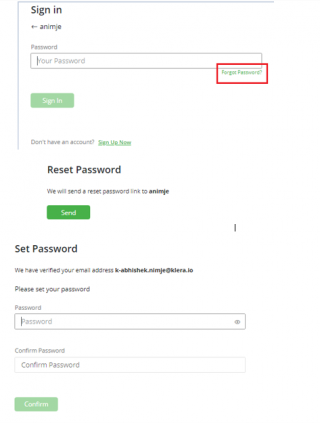
How can Basic Users reset their password, via forgot password option?
‘Forgot Password’ option works only if SMTP mail server is configured on Gathr Analytics. Please ask Admin/Author to configure SMTP mail server on Gathr Analytics if not already configured. We can refer to the below link to configure SMTP.
Once SMTP mail server is configured on Gathr Analytics, please follow the below steps to reset your password.
- Click on ‘Forgot Password’ option on the sign-in page.
- You will get an option to send password reset link to the email address associated with Gathr Analytics user.
- Once you receive the reset password link, please open it in browser, you will get the option to reset the password.
How to Edit Athena SQL query and Get Data on existing Container?
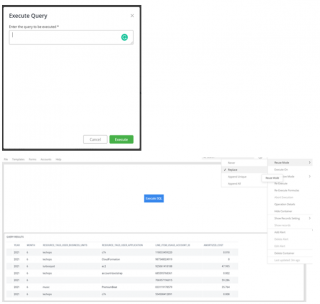
You can achieve this in Gathr Analytics with the below steps:
- Please right-click on the floor–Athena Instance–Execute SQL.
- It will open a form, please provide your query input here.
- On executing the query, you will get “Query Results” dataset in the view panel. Please drag it to the floor.
- Click on the three dots menu of the “Query Results” container. Go to ‘Reuse Mode’ and select ‘Replace’.
- Now, if you edit the SQL query and run the operation “Execute SQL”, the “Query Results” container will be updated with new data.
How to Append Unique records in existing dataset through JQL operation?
- Append Unique: This mode ensures that the new data will get appended to the existing records. Append Unique ensures that only unique records are retained.
- To append unique records in the existing dataset through JQL operation, please see below steps:
- Click on 3 dots Menu of container – Reuse Mode– Append Unique.
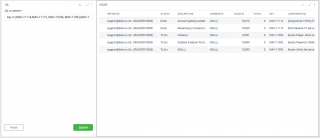
- Keep the JQL form on the same floor where you have placed the container. Please refer to the below snapshot.
Now, when the user executes a JQL operation, the ‘Issues’ container will be updated with new unique records appended to the existing records.
How to create dynamic Jira JQL from ReportPortal data?
Consider, we have executed ReportPortal operation, and in the data set we have a Column related to JIRA issue keys. Now, we want to fetch JIRA issues from these keys. There can be 2 possibilities, either key cell can be single value or multi-value.
- Single value:
Please refer the below in snippet, KEY column under the single value.
Add formula:
- JQL_KEY=CONCAT(“key=”, singlevalue.Key)
You can execute JIRA operation on the context level. Select the value(s) from JQL_KEY column, right-click on it - JIRA instance - Execute text as JQL.
- Multi-value
Please refer the below snippet, KEY MUTLIVALUE column under multi container.
- Add 2 formulas:
- Concatenate=CONCATENATE(multi.’Key multivalue’, “”, “”, “,”)
- JQL Key=CONCAT(“key in (“, multi.concatenate, “)”)
- Select the value from JQL KEY column, right-click on it - JIRA instance - Execute text as JQL.

How can I navigate to page with a button?
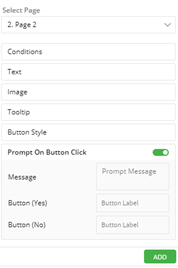
- Select the view from where you want to navigate to a new page and click on Visualization panel.
- In data configuration section, you will find list of all Columns, and in the end of list, you will find an option to Add button. Click on it.
- In the select page section, choose the page number you want to navigate.
- You can also add a prompt on button click and customize the message.
- After doing all the customization, click on Add.
- On the View/Container, a new column will be visible and with each cell you will have buttons.
- Now, when you click on it, Gathr Analytics navigate to the desired page.
Can I execute an operation with a Button?
Yes, you can execute operation with a button.
Consider, if you want to create button such that when you click on it, returns of list of JIRA boards.
- Right-click on Floor - Jira Instance - Board - View all boards. Now, towards right of View all board label, you will find the option to create a button. Click on it.
Please refer the below screenshot
- You will get a pop-up form to configure button, click on Submit.
- On getting the view in the view panel, please bring it on the Gathr Analytics floor. Now, when user clicks on the button, boards are fetched from JIRA.

Can I add a button to re-execute a Dataset?
Yes, you can add refresh button to the Dataset.
- Select the Container and go to Data panel. Choose the Dataset associated to your view/container.
- Click on the 3 dots menu of the Dataset, and select ‘create button’.
- You will get a pop up to configure the button. You may update 1 or more list of Datasets you want refresh, label, and tooltip title.
- Click on submit.
- You will get a new View, please bring it on Gathr Analytics floor. Now, when you click on button the Dataset will be re-executed.

Can slicer view filter the data across the multiple dataset?
Slicer view can filter the views/data only in the same dataset. So, slicer created from on dataset ‘A’ will not filter dataset ‘B’. This is an expected behavior of Gathr Analytics.
However, we have provided the feature in the higher Gathr Analytics release 6.4.9.0, to allow user filter data across dataset from slicer view.
Release notes are available at https://support.klera.io/hc/en-us/articles/4402460366745-New-UI-v6-4-9-0-Beta
If you are using older version, you may create a Pivot view to filter it across these 2 or more views. For upgrading to higher version and more information, please reach out at support@klera.io
How to use regular expression in data scope filter?
We have created a document on how RegEx can be used in data scope.
Doc also have the CSVs which you can upload in Gathr Analytics and use the sample data to follow along.
Download the document from the given URL. https://expanse.Gathr Analytics.io/s/jkNbG3wytrcX4Ao
How to separate a multi-valued column to single value?
We can use tokenize formula.
- Select the container and add formula. TOKENIZE(TestItems.ColumnName, “,”)
- Please bring the formula in Data configuration.
- Now, select the formula column name on the container, right-click on it - Formula - Remove Duplicate.
- User will get a new view, please bring it on the floor.

How to replace a container when you are executing operation with form operation?
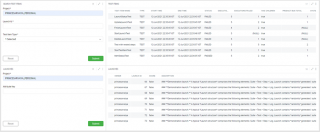
To replace the container using the form-based operation,
- Click on 3 dots Menu of container and click on Replace.
- Keep the same form on the floor where you have placed the container.
Please refer the below snapshot.
- Now, when user executes the operation, the container will work on Replace mode.
- If the form is placed on the left panel, and we do replace on container, it will not work.
- As the form is accessible from all exploration pages, and we don’t want any other containers to replace. Hence, user must bring the form on Floor to work it on Reuse: Replace.
Can I re-execute Operation in a published Exploration?
No, we cannot execute an operation in a published exploration. Published exploration is used to share insights with other users in a read-only mode. Users can perform activities like highlighting, filtering, page navigation, and viewing full-screen charts.
Why other users are unable to see data from my shared Dash Board?
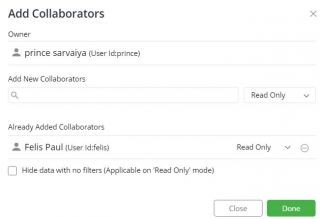
While sharing an Editable App in ‘Read Only’ mode, App owner can define which rows of the data should be visible to users with whom the App has been shared.
Gathr Analytics provides row level security to let App owners control data visibility for read-only users, through ‘Named Filters’. As user cannot see any data, uncheck the option to hide data without filters and click on Done.
Please refer the below snippet.
How to change JQL input of existing Editable App?
User can click on the execution graph and select the operation name to check the parameters. Also, user can click on the 3 dots menu of the container and select operations details.
Consider you have fetched JIRA issues from the JQL form. Please click on the data panel and search for the issue dataset.
- Select any column of the issue dataset, click drag on the Gathr Analytics floor, on a fresh new page.
- Then, please bring the JQL form on the Gathr Analytics floor where you have placed the issue.
- Click on the 3 dots menu of the issue container and select Reuse mode - Replace.
We highly recommend taking backup before you proceed with any change.
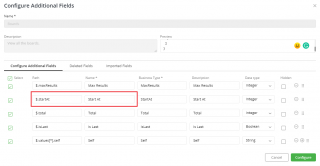
- Custom Fields not reflecting post Configuration in an existing Data set for an Operation.
Please verify the below points if Custom Fields are not reflecting in Dataset.
- Check if Dataset has been generated on the same Operation for which we have configured Custom Fields.
- Verify if we have selected the correct Instance and Operation from the drop-down menu while configuring Custom Fields.
- Check if we get the required Custom Fields on “Configure Additional Fields” form.
Use Exploration History to identify failure in Exploration.
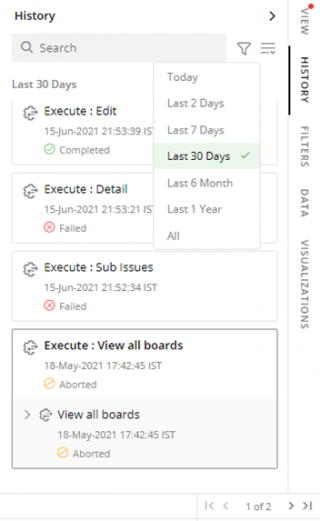
Exploration History shows details of all the Operations and Templates run in an Exploration. These details are shown in reverse chronological order. We can use Exploration History to identify failure in an Exploration.
Click on the ‘History’ Panel on the right side to see the following details:
- Operation Details
- Name of the Operation/Template.
- Status - Waiting, Processing, Completed, Failed or Aborted.
- User Id of the User who performed this operation.
- Execution Start and End Date-Time.
- Service Name (Tool from which data was fetched).
- Datasets generated by this Operation.
- Number of records generated by this Operation.
- Visualizations present on each of these Datasets.
The following actions can be performed from the ‘History’ Panel:
- Abort or Re-Execute the failed Operations.
- Filter the History for a Time range.
- Search the History.
- Navigate to a Visualization.
Basic Troubleshooting steps if Exploration Execution Failed.
Please check the below points to identify the failed Operation.
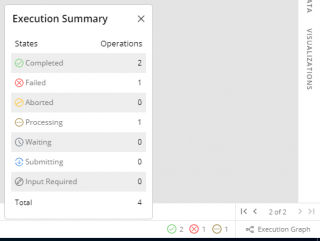
In ‘Execution Summary’ at the bottom right corner, you can find the number of Operations Processing/Completed/Failed/etc.
We also have ‘Execution Graph’ in the bottom right corner, where users can see the status of Operations/Formulas and can identify if the failed Operation is in the Execution flow. The failed Operations/Formulas are highlighted in red color (PFB).
User can get the following details for Operations, Datasets, and Formula by selecting their nodes:
- Operations: Status, Start and End time, and Operation parameters.
- Datasets: Columns and Visualizations created on this Dataset.
- Formulas: Dataset name, Computed column name, last execution status, and the Formula.

Basic troubleshooting steps if exploration execution stuck in ‘Waiting for User Input’ status.
If an Exploration/Dashboard is stuck in ‘Waiting for User input’ status; please check the below points for basic troubleshooting.
- Check if any Operation is waiting for user input in execution summary at the bottom right corner.
- Check if there is any tab(s) blinking, here you will get an interactive wizard to provide inputs.
- Check if any of the containers are put on ‘Manual Mode’. You will see Symbol ‘M’ on the top right corner of the Container that has been put on Manual mode. Please change the execution mode from Manual to ‘Operation Complete’.
- You can enable this by clicking the three dots menu of the Container– select ‘Execute On’– select ‘Execute’ under ‘Operation Complete’ tab.
Does Gathr Analytics support AI/ ML algorithms?
The Gathr Analytics platform is powered by AI and ML capabilities that enable advanced and predictive analytics. Gathr Analytics provides out-of-the-box ML functionality for applying unsupervised/supervised learning models, clustering algorithms, sentiment analysis, what/if analysis, predictive analytics, recommendation engines, etc.
Users can bring their own Machine Learning Models, developed outside of Gathr Analytics, and register them for instantaneous usage as well.
Who are all your clients in the ITES domain?
Clients in ITES segment to name a few - Global Logic. We also have partnership with esteemed Organizations i.e. Infosys Ltd. & Wipro Ltd
Who all are Klera’s Competitors?
Competitors to Gathr Analytics are use case-specific and there is no direct competitor as such. Gathr Analytics can be easily extended to connect with any tool or database of choice and solve a wide variety of use cases across all business functions. So, some competitors may be only into fetching data from multiple tools but do not perform advanced analytics/workflows Some are only about allowing users to create workflows and automate data synchronization and have very brief/ no analytical capabilities. With some, the case could be they require a central repository for storing data from multiple tools requiring dedicated ETL effort and resources, unlike Gathr Analytics which does contextual fetching of data. Therefore, depending on the use case/ application, Gathr Analytics can be compared to vendors offering solutions for value stream management, business intelligence, workflow automation, security information and event management, application lifecycle management, DevOps, etc. However, they solve just some section of overall problems that Gathr Analytics can, the competitors do not cover all the aspects like:
- Insights
- Connection to multiple tools/ databases
- Custom workflows
- Synchronization
- Advanced analytics
- Extensibility
- Formula & AI/ML Engine
How can Gathr Analytics help Organizations/Teams - in being responsive and proactive to day-today Business challenges?
Gathr Analytics, with its inbuilt computation and AI/ ML engine can give a lot of relevant insights to its business users: Be it about an incident/ data of past like -
Causal factor for SLA Breach
Traceability to defects and agents involved
Unified view of marketing, sales, and support data to enhance customer retention - Upsell, Cross sell scope Or be it about a futuristic prediction and giving a guiding insight like -
Early conflict detection
Early warning system - where Klera’s interactive dashboard helps in detecting schedule variance and provides ML-based delivery predictions to make necessary adjustments and plan for timely, high-quality deliveries.
How can Gathr Analytics help in monitoring CI/CD Pipeline effectively?
Most DevOps implementations involve complex toolchains, which make it difficult for delivery leaders to keep track of the
- Progress
- Performance
- Quality parameters at different stages of the pipeline.
Gathr Analytics helps in resolving this complexity by connecting with various tools across a CI/CD pipeline and offering a unified platform to compute, analyze, and track critical metrics such as:
- Code coverage
- Technical debt
- DORA Metrics like - Lead time, Deployment Frequency, Change Failure Rate, MTTR
By monitoring trends over a period, teams can make informed decisions to resolve an immediate issue or a lingering bottleneck affecting their deliveries.
Solution Highlight: Bi-directional intelligent connectors - For Git, Jenkins, Sonar, Artifactory, and more to collect data and assess the performance and quality of deployments in a unified way
Extended build pipeline monitoring to include- application monitoring (Nagios) and container monitoring (Kubernetes)
Improved real-time awareness - by setting up cognitive, proactive alerts spanning various tools to resolve critical issues immediately.
How to use ARIMA ML Model in Gathr Analytics
Yes, the ARIMA ML model is supported in Gathr Analytics. You can use this using the python script provided by Gathr Analytics Team. To use ARIMA, the following are the pre-requisites:
- Gathr Analytics Script Integration Service (Installed).
- As the script uses python below two libraries are required to be installed on the Gathr Analytics Server: a. pandas (Comes by default with the Python) b. statsmodels (Needs to install separately while importing script).
In order to use the ARIMA Model script, you are required to follow the below steps:
- Import the ARIMA Model Python Script (Make sure to unzip the folder and upload the .py file only) on Gathr Analytics shared by Gathr Analytics Team or download using the below link:
https://expanse.klera.io/s/5MGBmkxePN3W6w5
NOTE: Please make sure to put the statsmodels package name in the second section of the form while importing the script on the Gathr Analytics.
- It will ask for below 3 inputs in the later steps: a. datecol - This is the DateTime type Column required as input for cost forecasting. b. datacol - This is the Integer type Column required as input for cost forecasting. c. numSteps - This is the Integer type Column required as input where you need to enter the total number of forecasted values using the model.
- Your script is now registered.
- To run the script go to the Scripts– Operations–{Menu Heirarchy} and run the operation.
- It will ask you for the inputs mentioned in step-2 and submit them.
- The resultant dataset will bring all the forecasted values using ARIMA ML Model.
How to mark an operation as a favorite operation?
In Gathr Analytics you can mark an operation as a Favorite Operation. By marking than operation for a context, you don’t have to do a right-click and navigate to that operation but just by selecting the value that operation will run.
Steps to mark Favorite operation:
- Select any contextual value and navigate to the operation which you want to mark. In this case, I want to mark from Jira Projects – Boards and check the Right Tick mark available.
- Going forward, whenever you perform any click on Jira Project, this operation will execute. You can define other series of operations based on the output of the Boards dataset. This means, with a single click you can perform single or multiple operations.
- Currently, you can mark only one operation as a Favorite operation.

Is there an example of a Data Collection use case that can be solved with Gathr Analytics?
While Gathr Analytics can connect to almost any data source to collect data. A typical use case we have solved is conducting Surveys and Polls. Gathr Analytics allows you create and conduct customized surveys and get real-time analytics on the collected responses.
What kind of survey apps can I create on Gathr Analytics?
Build your own forms, with different types of questions - multiple choice, ratings, descriptive, etc., to collect data from users. Get product feedback, conduct market research, or measure employee and customer satisfaction.
Are the survey analytics provided in a standard format?
No, the analytics can be customized as per your requirements. Gathr Analytics allows you to apply computations and advanced analytics to gain insights into survey responses. You can uncover trends and patterns by performing text and sentiment analysis.
Can I create an Enterprise Search app on Gathr Analytics?
Yes, leveraging read/write capabilities, data mining, analytics, machine learning (ML), and natural language processing (NLP), our solution for Enterprise Search enables unified, fast & intelligent content discovery across all unstructured and structured data sources. Find the information you need with a single search query, irrespective of where it resides. Visualize search results in interactive formats, correlate data, and derive meaningful insights.
Can Gathr Analytics help me track if my team is adhering to standard processes and policies, and making timely entries and updates?
With greater visibility across processes, Gathr Analytics enables you to identify and address compliance gaps to ensure data quality. You can track missing data values and inconsistencies across processes, analyze fields with null values and drill down to their priority level, assignees, etc., identify compliance training requirements, and perform bulk updates to fix information gaps.
What kind of planning apps can I create on Gathr Analytics?
Gathr Analytics allows you to create any planning app that requires defining workflows, assigning tasks, collaboration across teams, and tracking KPIs. You can monitor the progress of your plans, identify gaps, and take corrective actions to ensure successful execution.
Can I create a PI Planning app on Gathr Analytics?
Klera’s PI planning app allows you to plan new releases, create issues, and move backlog issues from past to current PI, using a single interface. It ensures real-time, bi-directional sync with your project management tool. Further, you can track KPIs across teams and sprints to ensure effective planning and discover date conflicts, workload conflicts, and project dependencies, to plan corrective actions.
Basic Concepts of Gathr Analytics
Gathr Analytics has following major entities to start with:
- Operation: In Gathr Analytics, it is defined as the action/set of action which a user takes in order to Generate Data, Call Data or to Write Back Data. After successful execution of an operation it will always provide you with an output data.
- Datasets: Datasets in Gathr Analytics is defined as the set of data on which a user can perform further analysis whether he/she can create graphs, charts etc on the top of it. Datasets lies in the Data Panel of your exploration. Using a Dataset, one can create as many Containers or Visuals according to the need.
- Container: Container in Gathr Analytics is defined as the Visual representations of a Dataset put on the floor of the Gathr Analytics. A Container can be of any Visual type, it may be a Pie Chart, Bar Graph etc.
- Write Back: Write Back in Gathr Analytics is referred as Creation/Updation/Deletion of the Data from your system/tool onto other. Using Gathr Analytics, you can perform some operations which in return actually create, update or delete the data from your live running systems/tools according to your need. For ex. you can fetch ServiceNow Incidents using one operation and you can create Jira Issues for these Incidents by just using an another operation in Gathr Analytics.
- Exploration: Exploration is a place from where a user starts exploring Gathr Analytics. A user is always required to create a new Exploration and then can start his/her work. The Exploration contains all the details related to the Datasets used, Operations Performed, Formulae Created etc. You can use an Exploration to save your work in different types for ex. Templates, Applications etc.
- Template: In Gathr Analytics, Template consists a set of all the actions which user took to produce a Dashboard. Templates are shareable with other users and hence is a kind of Macro which is reusable later by anyone. For ex. A user brought Jira Issues for a Project of his organization, created formula on the Datasets and created Visuals on it. Now, the whole thing can be shareable with a user of different organization who wants to perform the same kind of analysis but on the Jira Project of his organization. One can create a template of his/her own work and create a Template of it to share with others or to re-use it later.
- Application: Application or Apps in Gathr Analytics is defined as ready to use standalone entity using which a user can perform his/her work which he/she intended to perform by using that App. Using an App, a user will have a limited experience which is designed for him/her by an Author(Who created App). For ex. An HR of an organization designed an App to take survey from all of the Employees. In this App, An Employee will only see the survey questions and can write his/her answers but HR who created this App had all the visibility related to the responses.
These are some major entities of Gathr Analytics to help a user to get started.
Base Logic before you solve any use case
In order to solve a use case on the Gathr Analytics, the user would require following:
- Data
- Actions
- Write Back/Visualize
Let’s understand these entities to solve a use case on Gathr Analytics:
Data: It refers to the data or the datasets which a user requires to perform some kind of analysis or it might be required to perform certains action on it. On Gathr Analytics, the user can fetch the actual data from any tool/system by establishing a connection to it. For ex. a user can fetch the data from their Jira Server in order to analyse issues. The user can also create Gathr Analytics forms to capture data from humans.
Actions: The terms Actions refers to the set of operations a user may need to take in order to transform the data to consume it in an easy way. For ex. a user might need to apply some ‘Klera Formula’ to count some values based on a condition or a user might need to perform ‘Remove Duplicates’ in order to get unique values from their datasets.
Write Back/Visualize: Once a user is done with their consumable datasets, the user can visualize their datasets with the numerous views present in the Gathr Analytics Visualization for ex. Bar View, Matrix View, Line View etc. Also, according to a use case, the user might Write Back these datasets to their natives tools/systems or the databases.
How do I setup background schedules?
It is really easy to set up a background schedule in Gathr Analytics. Please use the following steps to set up a schedule.
- Open any exploration in which you want to set up a schedule
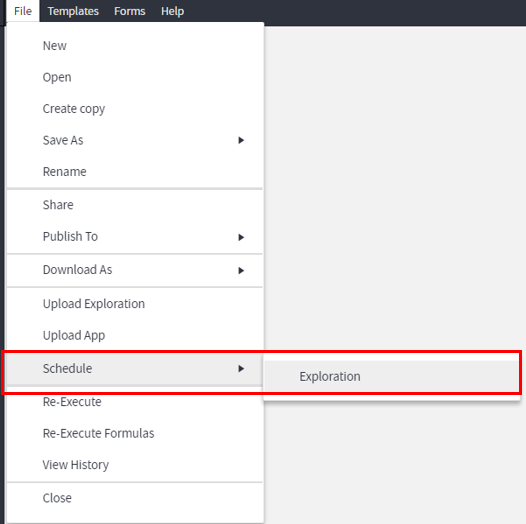
- Select “File” option from the file menu at the top and select “Schedule” and then “Exploration” as shown in the image below.
After doing those steps you will get the pop-up window like this,
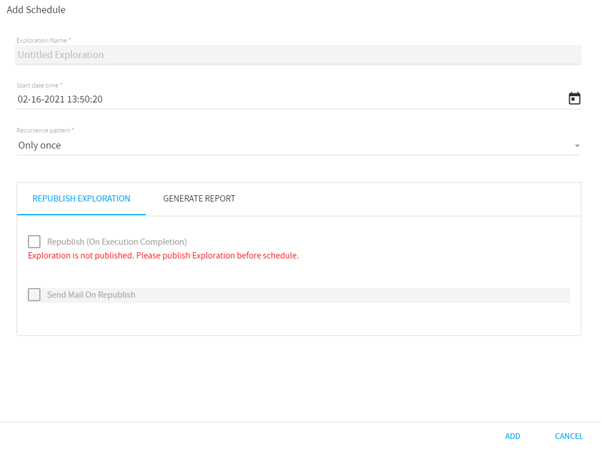
There are different options that you can use in order to set up a schedule.
- Exploration Name is the name of your current exploration
- Start date time is when the first time your schedule will run
- Recurrence Pattern is how often your background schedule will run and that has different options as shown below and you can select appropriate option as per your business needs.

For example: If you select Daily as your recurrent pattern, you will get the following options
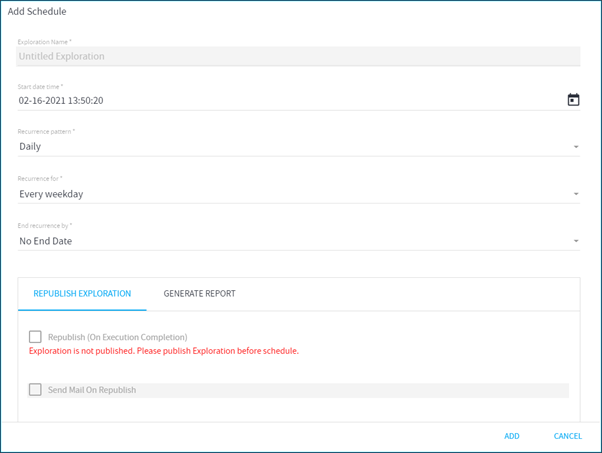
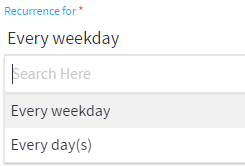
If you select Recurrence for , you will have two options two select from. Every weekday or Every day(s)
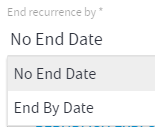
At last, you have an option of “End Recurrence by”. You will have two options as below. If you select “No End Date” option, that means your background schedule will run forever unless you decide to end the schedule. If you select “End By Date” option, that means you will have to provide a date when this schedule will stop running.
I have a dataset with category column and need to extract a unique list of categories. How can I?
It is really easy to do that in Gathr Analytics. This can be achieved by using Remove Duplicate option in Gathr Analytics. You can follow these steps to achieve that.
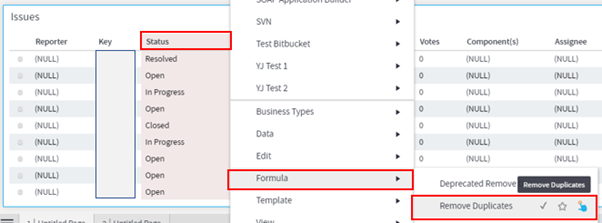
- Select Category Column of which unique records you like to get
- Then right-click on the column and then go to the Formula option from the list and select the Remove Duplicate option as shown in the image below
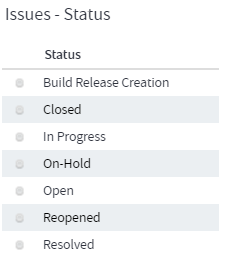
- This will give you a unique list of categories
Hope this helps. If you have any questions, please comment below.
How do I find out the explorations scheduled enterprise wide?
You can easily find out what Explorations are scheduled enterprise-wide. The only condition is that you should have Sysadmin Role assigned to you or you should be Gathr Analytics Admin.
Please follow these steps to find out the schedule of all the Explorations:
- Open a new Exploration and right-click on the floor
- Then select the Administration option from the bottom of the list
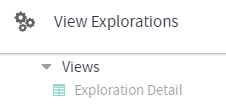
- Go to View panel on the right side and from the View Explorations, select exploration detail as shown in the image below
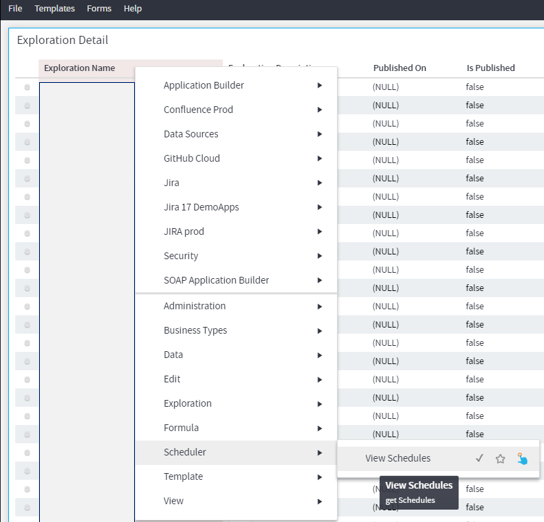
- Then select Exploration Name from the grid on the floor and right-click. Then select View Schedules as shown in the image below
- Then from the view panel on the right side select Schedules
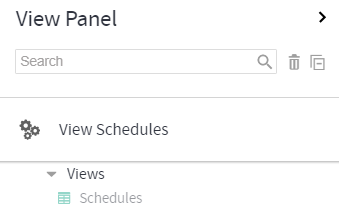
This will list out the schedules of all the exploration that you have enterprise-wide.
Where can I find the source of this dataset? Which operation did I run?
To find the source of any dataset, you can check the execution graph and find the parent of that specific dataset.
Brown nodes in the execution graph shows the Dataset and Blue nodes shows the operation Execute.

To check the input parameters passed to execute the operation, you can click on the 3 dots on any view of dataset, and Choose Operation Details.
How to understand the order in which operations were executed to fetch the data?
The 2 ways to understand the order in which operations were executed to fetch the data are:
History Panel - All the operations can be watched inside the History Panel in an Anti-chronological manner (latest first).
Execution Graph - Visually all the operations and resultant data set can be seen in a chronological order where Blue Nodes depict the Operations and Brown Nodes depict the resultant datasets.
How to assess which dataset’s field was used to create a formula in one of the dataset (e.g. VLOOKUP, COUNTIF)?
Execution Graph helps you to identify the datasets which have been utilized to create formulas that use data fields coming from multiple datasets.
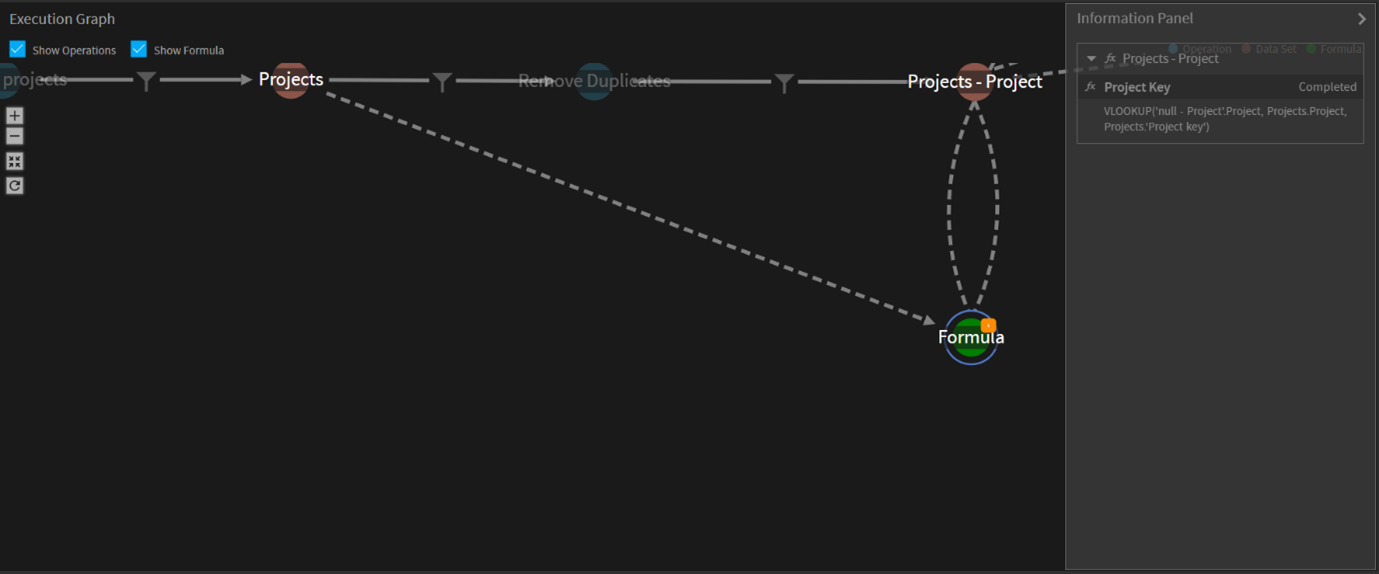
To understand this, go to the Execution Graph and zoom into the Green Node (Depicts Formulas of the same type grouped together). The type of formulas we are discussing here have 2 types of dotted relationship:
- Single Dotted Line - Depicts that one data field is coming from that particular dataset (Brown Node)
- Looped Dotted Relationship - Depicts that another data field is coming from that particular dataset and the resultant calculated field sits in this data set.
You can also click on this Green Node to see all such formulas grouped together which makes use of these 2 datasets fields.
How can I design dynamic data dropdowns in Forms?
It is really easy to create dynamic data dropdowns in Gathr Analytics Forms. You can follow these simple steps and try different combinations as per your need to provide a dropdown option in Forms. Example: -
- Let’s created a simple form consists of Priority, Type, and Status
- Condition: We only want to show Type in the form as a dropdown if the user selects Priority as “Medium”
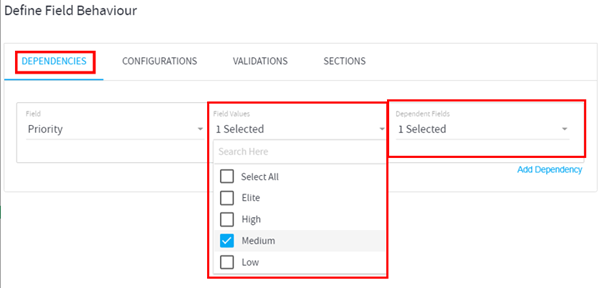
- To achieve that in the form, go to Define Filed Behavior option after creating fields in the Form.
- Go to Dependencies section in the form, then select Priority in Field selection on the left and select Medium as a Field Values which controls the behavior of our Type dropdown in the form shown below.
- Select Type in Dependent fields dropdown, which should be available based on Priority selection
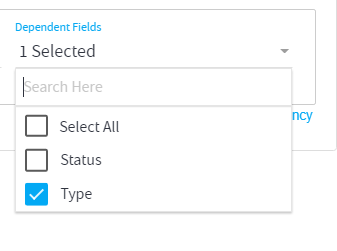
- Then Save the form
- By default our form looks something like this,
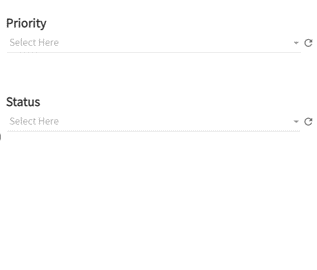
- Now select Medium from Priority dropdown in the form. This will give the option to select Type in the form.
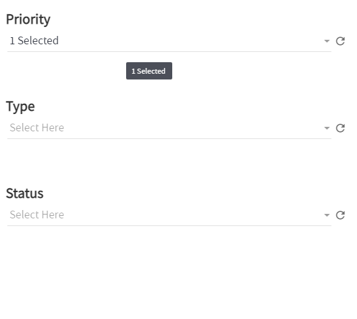
- Now you can save your selections in the forms and collect data accordingly.
You can of course provide multiple conditions and control multiple dropdown options if you chose to do. Hope this helps and if you have any questions, please comment below.
Can we collect data from users?
Yes, we can collect data from users. Collecting data from users may have variety of definition but on Gathr Analytics you can create app or solution which enables you to collect data from users and save it and use the collected data later for any insights or analysis. You can collect data from Gathr Analytics using:
- You can create FORMS using Klera’s form feature. You can design multi-level and intelligent forms on Gathr Analytics and prepare the forms with question(s) and take appropriate action on submit.
You can even store the submitted data directly into the Native database or any external database depends on your use case and workflow.
We are looking for an HR Onboarding solution. How can Gathr Analytics help?
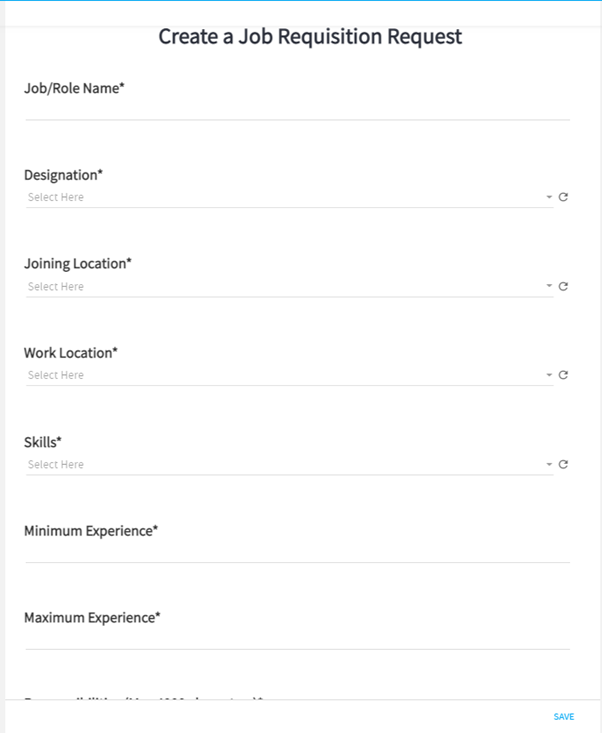
Gathr Analytics offers wide range of Apps as a solution to the problem of almost all the part of an organization. If you are looking for HR On-boarding solution then you can create an App which focuses entirely on capturing the workflow of On-boarding (Recruitment Process). For example you can create a solution like this.
- You can start with creating forms which captures your specific requirements against which you would like to onboard the candidates.
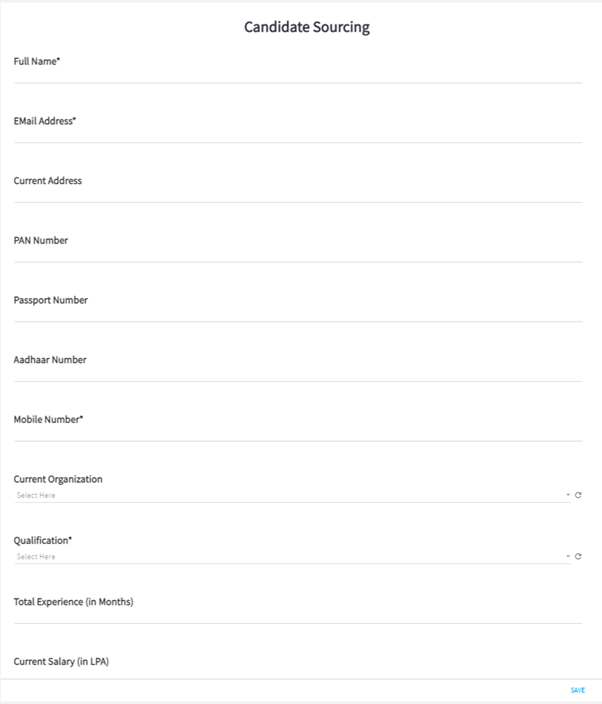
- Then the next step would be to capture the candidate profiles for recruitment process.
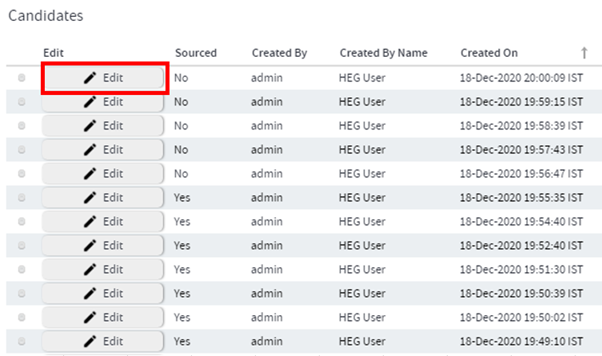
This wil also allow you to analyze the records you have created for Candidates and if you chose to edit some of the information of Candidate then you can do that as well.
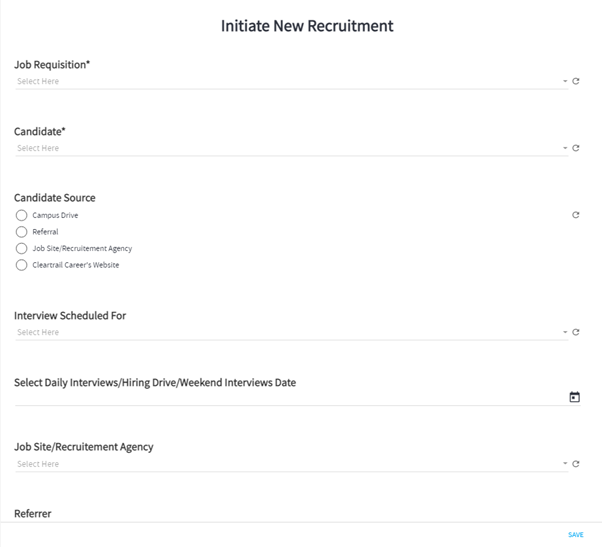
- In a same way you can create a form of for collecting candidates feedback. Forms allows you to capture all the information that you would like to capture during this entire on-boarding process. And forms are easy to create as well.
You can simply analyze your data as well using the information you captured using forms.
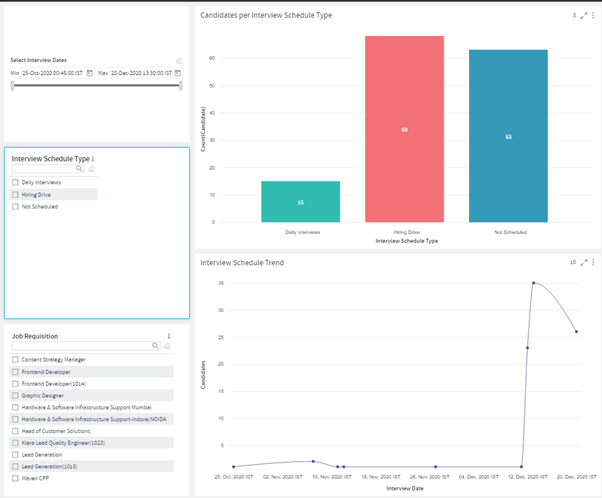
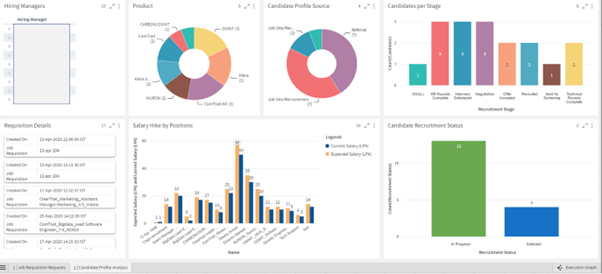
You can customize the solutions as per your need. Further more you can analyze the data after you done with you on-boarding porcess. Hope this helps, and if you have any questions please comment below.
What are the KPIs available on JIRA?
Gathr Analytics enabled you to connect with Jira (On-prem and Cloud - SAAS) and quickly realized multiple KPI’s. Here are the few popular KPI’s available for Jira or Jira with other systems:
- Lead and Work-in-progress,
- Early Warning System (Release Health and status tracking)
- Sprint health and status tracking
- Work Distribution
- DORA Metrics: Jira data is being used to calculate the DORA metrics which includes, Lead Time, WIP time etc.
How do I identify bottlenecks in my JIRA workflow?
Jira is a very popular Project Management tool from Atlassian. Gathr Analytics enabled you to quickly connect to Jira (SAAS or On-Prem both) using its bi-directional connectors. Bottlenecks in Jira depends on various conditions. You can detects bottleneck in handling backlog or Sprint Health or Release Health. Gathr Analytics provides some out-of-the box templates which will help you to identify these things. Gathr Analytics has “Compliance Analysis”, Backlog Analysis and even Release variance template which will enable you to find the bottlenecks.
I am looking for an Enterprise search solution to be able to search documents.
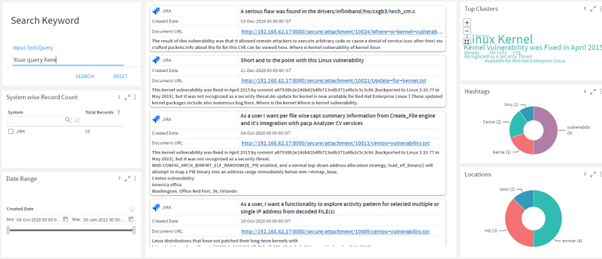
“Enterprise Search” as a solution is available on Gathr Analytics. This solution enables you to create use the Enterprise Search solution which is actually searching the user query into the content coming from different system like Jira, Confluence or any proprietary tool. Currently, solution available from Gathr Analytics is searching across Jira and Confluence. It also include the background Job which will keep harvesting the information from these system, perform AI/ML and extract entities and save in the local Elastic. Gathr Analytics also provides a search interface for end users where they can search the given term or query and see the output results along with extracted entities.
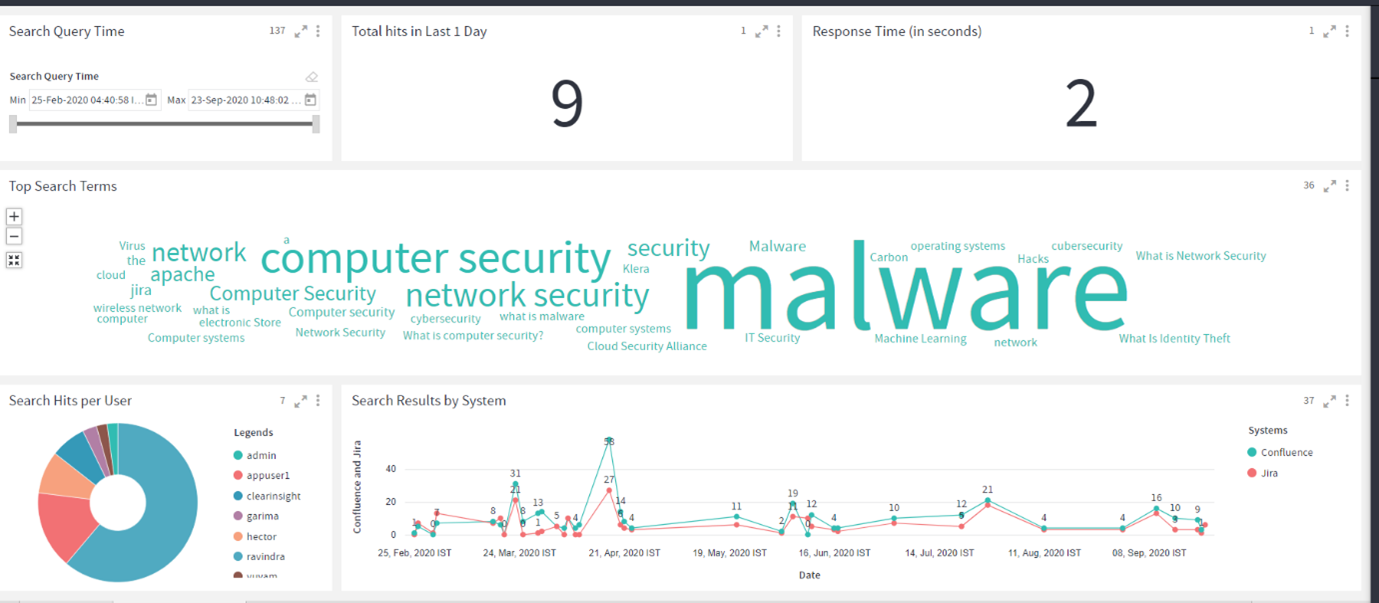
For administration, app app is available which will show the statistics of searches happening, search per user , document index per day etc. (as shown in below images).
How does Gathr Analytics enable traceability across systems?
Gathr Analytics is a data agnostic tool. You can traverse across the system like from data from one system will be feed as an input to get the relevant data from another system. This is quickly enabled by the huge worlds of connector provided by Gathr Analytics or you can also build your own connectors or even with CSV files.
For example, you can traverse from ServiceNow (aka SNOW) to Jira using any column in SNOW having Jira ID; You can right click on that column and Search the Given key in the Jira.
In the same way, you can go from Jira to Bitbucket by right clicking on the Jira key and fetch its relevant commits.
How can I find out the path forward for analysis?
First of all, in order to start working on any analysis, your most important question should be “what do you want to achieve from the analysis.”
- You need to define the KPI’s which can best represent the analysis and final outcome. Then find out what would be the data source for your analysis.
- There are multiple steps involved in the analysis, so you need to find out what data you should use for the analysis. Sometimes you can get the data from a single connector operation but sometimes it is not directly available. So you need to perform the contextual operation in that case.
For Example:
If you want to find out Lead Time then Jira would be the tool that you should go for. You will first get Jira Projects and then the Issues of those projects. Then you need to get the status of all those issues.
Then measure the time taken for the issue from the time it was “Created” to “Ready to work” and then “Work Completed” to “Close” state.
- Then comes the part of creating formulas and calculations. You get to this stage by analyzing your data for the analysis and you have a clear understanding of what formulas or calculations you need to perform on the dataset to get the desired outcome.
- When you have all the data you need for your analysis, then comes the process of how to best represent your data in the form of visualizations. This makes it easier for the people who are going to be using your dashboard or the report for making important decisions.
For Example:
- If you want to show the different status, type of category then donut or vertical bar chart is the optimal way to represent your data to the user. This process involves some trial and error until you get to the point when you can finalize your dashboard or the reports.
If you have any feedback on Gathr documentation, please email us!