Basic Concepts and Terminology
This article introduces helpful terms and basic concepts of Gathr Analytics.
Apps
Apps refer to small programs that can be downloaded and installed all at once.
An application (more commonly known as an app) is software that bundles together certain features in a way that is accessible to a user
An app is just software. Originally software that you installed on a computer as a program was labelled as an application - or the shortened name of app. However, the common usage of “app” versus “application” now generally refers to the distribution through app stores where the download and installation happen with a single action.
Simply put, an app is a type of software that allows you to perform specific tasks
When you open an application, it runs inside the operating system until you close it.
Rapidly automate and package complex flows or sequence of operations, with computations and machine learning.
Use smart connectors to read from and write-back to Connectors. Correlate and analyze data to drive informed decisions
Securely publish your own apps or use apps available out-of-the-box to collaborate, at scale, on a unified platform.
An App is a custom solution to digitize and augment common business processes, create unique visualizations to guide analysis for users, and collect data. These Apps can package complex flows or sequence of operations, with computations and machine learning. Authors can build Apps and make them available to enterprise users called App users. App users just need to open an app and run it for the purpose it was designed for.
When an author creates an app, they bundle together all the content that is necessary for that app to be utilized. Content may include data collection forms, dashboards, and datasets across multiple Connectors. Not every app will contain all this type of content. It all depends on what the author includes in the app according to the purpose of the App. In a nutshell, an App is a designed experience created by an Author for App users.
Editable Apps
Editable App is the editable workspace where the Author designs and builds an App. Gathr Analytics provides WYSIWYG (What You See Is What You Get) interface to build Apps, i.e. You can experience the App while building it.
In an Editable App, Authors can add Forms to collect data from end users, Run Operations to fetch data from other tools and Connectors, perform analytics, apply formulae, filters, and create a variety of visualizations for interactive and intuitive representation of data.
You can collaborate with other authors by simultaneously working on an Editable App.
An editable app can be scheduled to refresh the data at a regular frequency.
Note: Only Author can create/edit an Editable App.
Solutions
Solution is a collection of Apps. All the Apps contained in a Solution together solve a larger business problem.
For example, in Tools Synchronization such as ServiceNow and Jira, you need Apps to expedite tracking, qualification, and prioritization of support tickets, automatically identify and group duplicate tickets and Sync data across tools to automatically create corresponding issues for resolution
You can create standalone apps for each one of these requirements and save them in a “Tool Sync Between ServiceNow and Jira’’ Solution. This Solution becomes a collection of Apps for all tools synchronization related business problems.
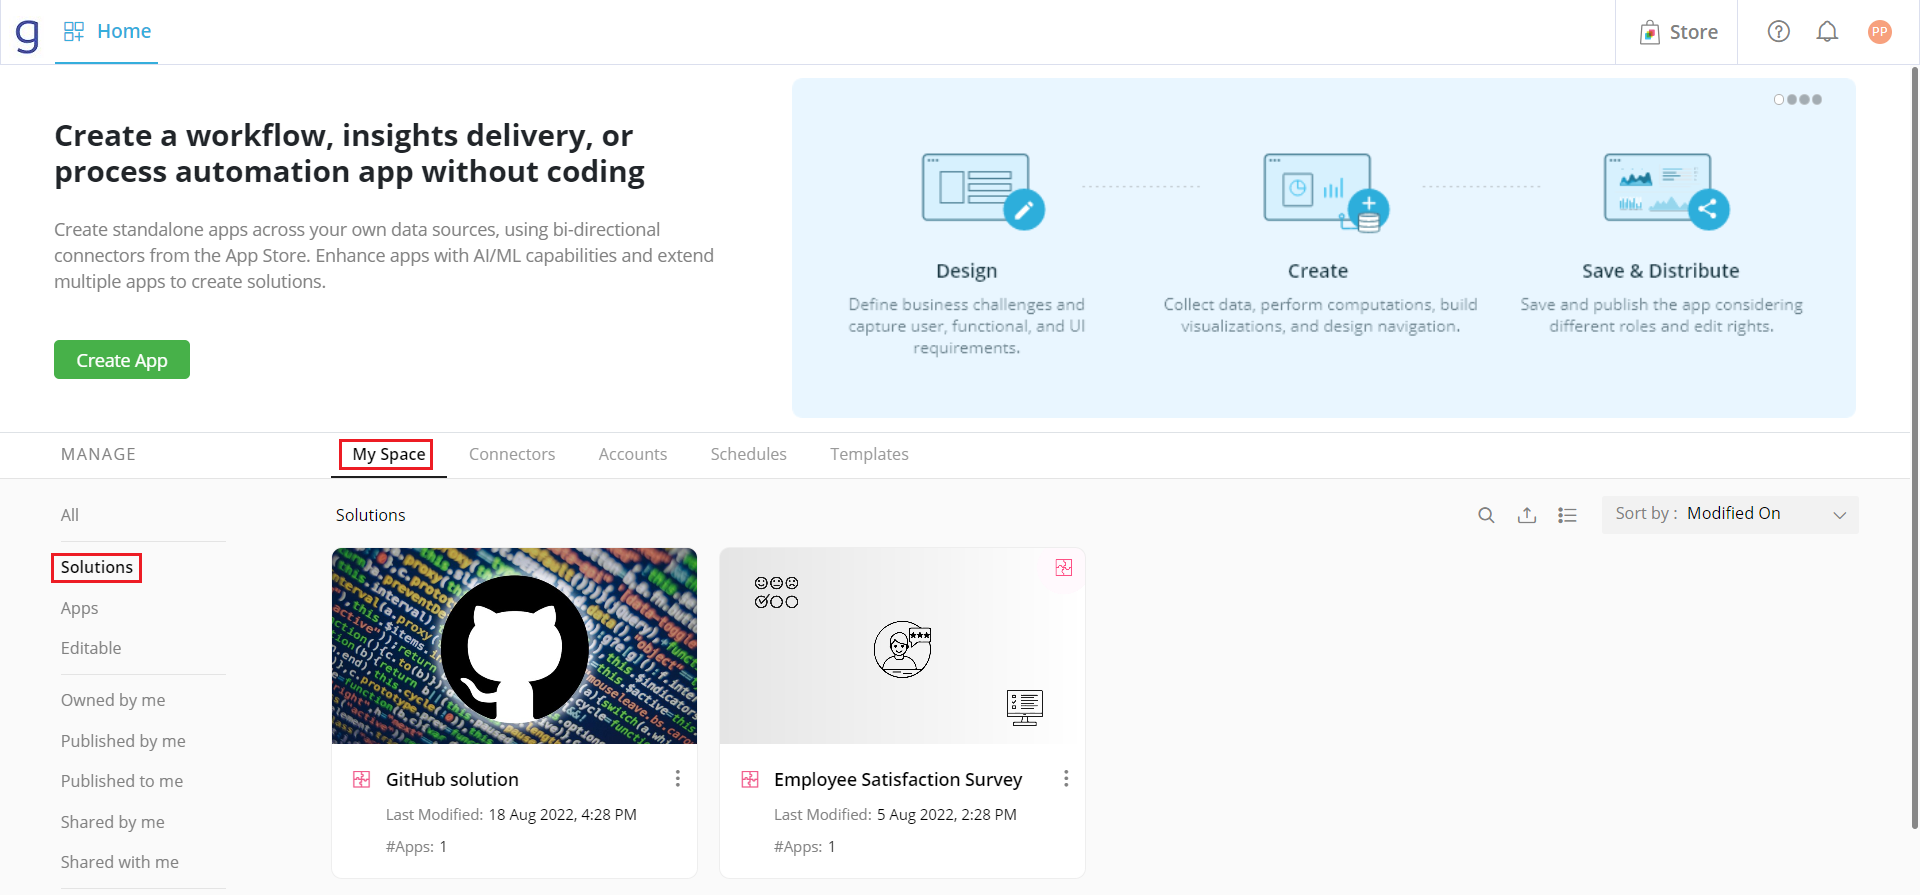
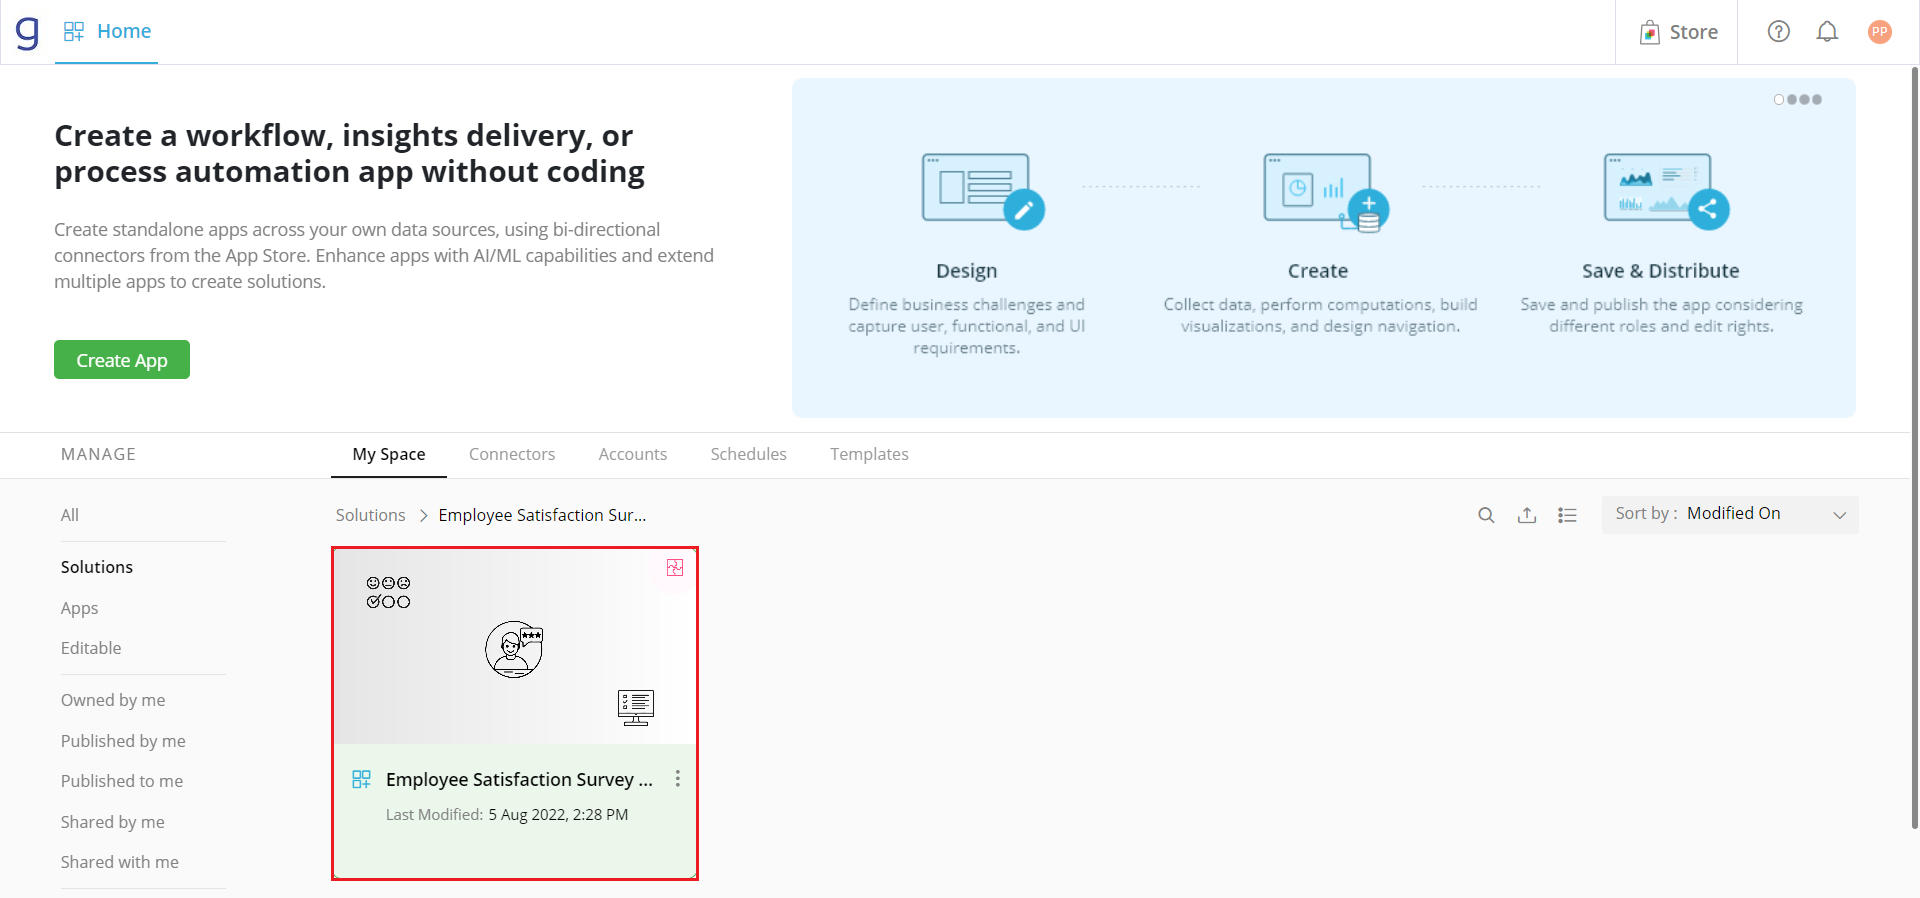
Double-click on a Solution to see all the Apps in that solution.
Context Menu on Floor
In an Editable App, Right-click anywhere on the empty Floor to get the context-sensitive menu. This menu is called the Floor Menu, it lets you run operations to fetch data from tools, and Connectors.
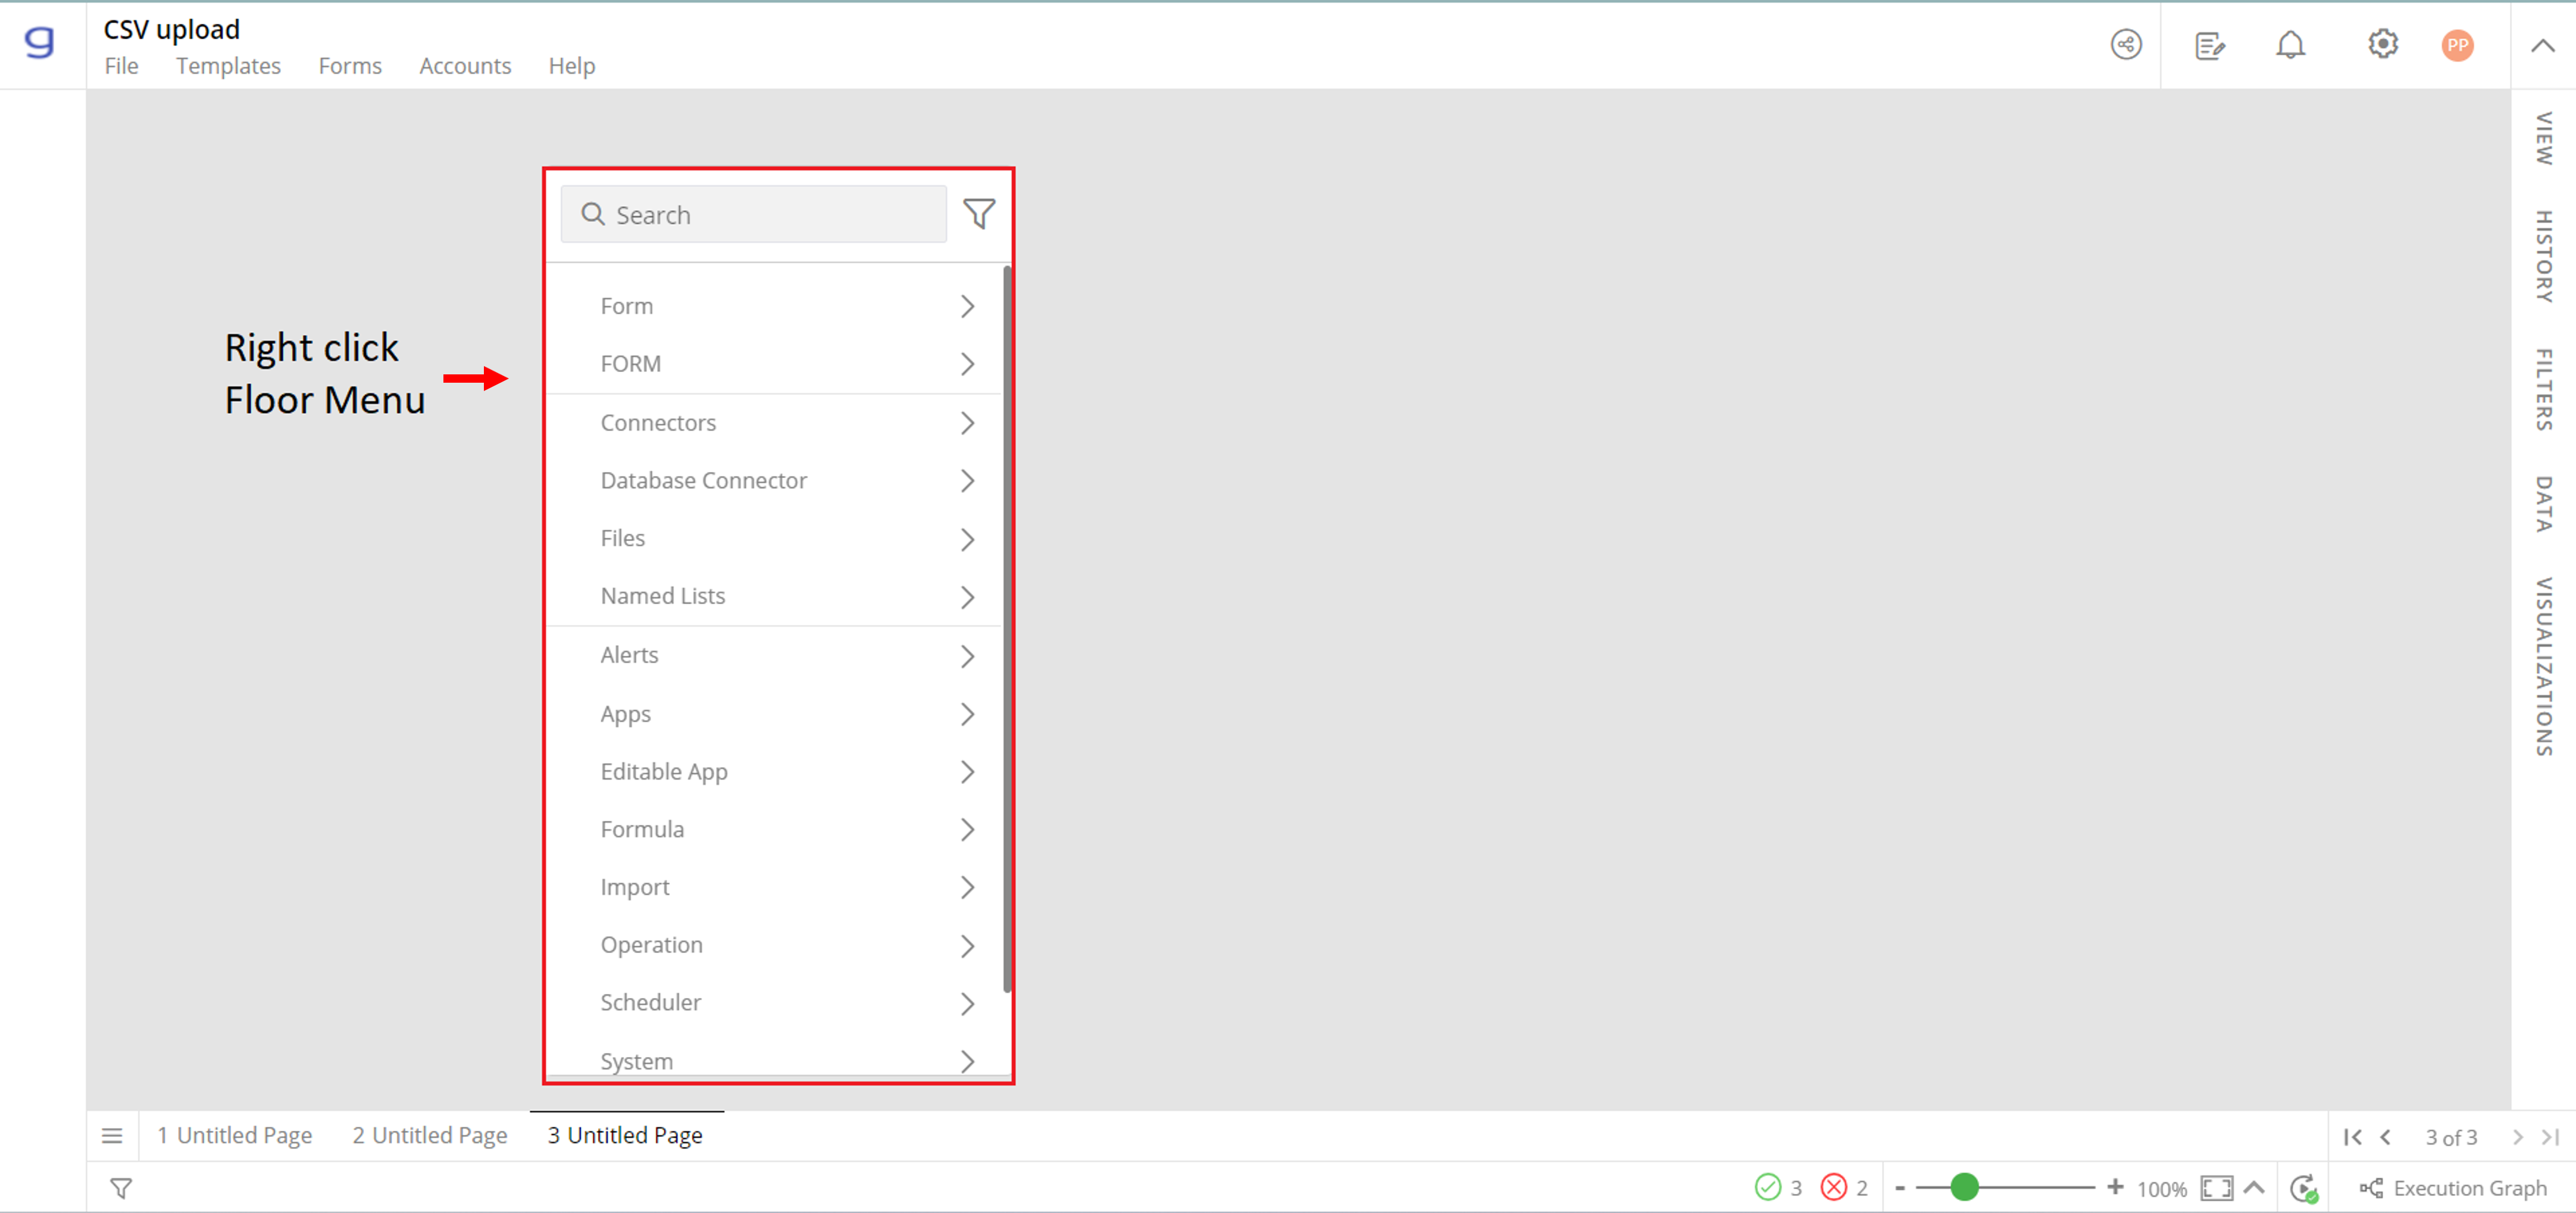
Floor Menu
If Floor space has been occupied by data containers, then right-click on Gathr Analytics Header, Footer or Left Panel to access Floor Menu, as shown below.

Context Menu on Floor
Context Menu on Data
The elements of a view (e.g. Grid cell, Pie slices, etc.) represent data. When you right-click on any data in any visualization, Gathr Analytics shows a Context-Sensitive Menu. The context-sensitive menu lists the operations provided by the connected tools/systems/databases (e.g. Jira, ServiceNow etc.) . You can run these operations by clicking on the context menu option.
Gathr Analytics understands the type of data you have right-clicked on and shows the operations relevant for the selected data’s type. For example, if you right-click on “Jira Issue Key”, Gathr Analytics will only show operations that accept “Jira Issue Key” as input parameter (e.g. “Get Linked Issues”).
The following image shows the menu options available on “Assignee” in Jira shown in the Bar chart.
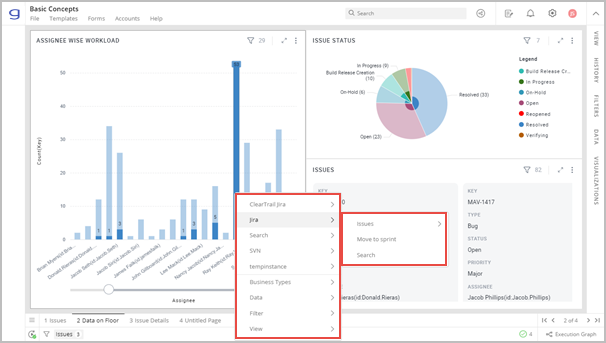
Context-Sensitive Operations
Whereas the menu options on “Issue Type” in the Card View are different.
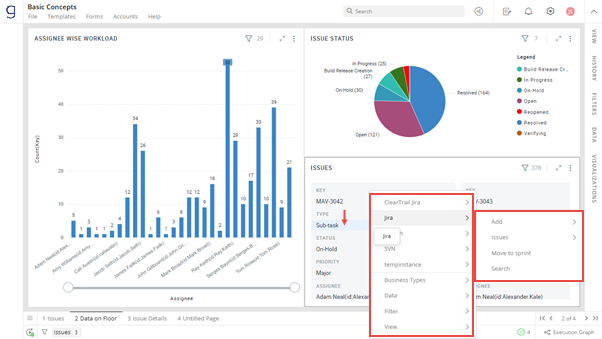
Context-Sensitive Operations
Connector
Gathr Analytics lets you read and write data from a variety of Connectors. A connector could be a tool like Jira, Jenkins etc. or a database like MySQL, SQL Server. You need a Gathr Analytics Connector to read and write data. Gathr Analytics connectors are bi-directional hence allow read as well as write data to these Connectors.
Gathr Analytics provides several off-the-shelf Bi-directional Connectors on Gathr Analytics App Store. Authors can simply get the connectors from the App Store and connect to a wide range of popular Connectors like Jira, Jenkins, Git, SFDC, SNOW etc.
Connectors provide a means to connect to your e.g., Systems, Tools, Platforms and Databases. You can download Connectors from Gathr Analytics Store (Available at top right corner of Gathr Analytics Home.) Connectors know how to bi-directionally (i.e., Read as well as write data) talk to Tools/Systems/Databases using REST, and JDBC protocol. A connector only contains the rules and protocol to talk to a System/Tool/Database. e.g., Jira Connector knows the rules to talk to a Jira server. To connect to a Jira server, you need to create an connection of a Jira connector (as explained in next section.)
Connection
A connector contains all the rules to talk to a tool/system/database e.g., Jira connector knows how to talk to a Jira server on REST protocol. Now to connect to a specific Jira server you need a connection of a Jira connector.
While creating a connection of a Jira connector you need to provide the end-point details (e.g., URL) of the chosen Jira server. Using this connection, you can connect to the chosen Jira server. While connecting to a Jira server you need to provide Account details (Explained in next section).
Accounts
An Account simply is your login credential to connect to your Tool/System/Database. In our running example, to connect to the chosen Jira server you need to provide your Accounts details (Login Credentials.) Account details authenticate and authorize the connected user. Tools may support different authentication schemes like Basic, Token, OAuth, OAuth2 etc. Gathr Analytics supports these authentication schemes to securely connect to these tools.
Interestingly, you may use same account details to connect to different tools/systems/database if they share the same login details. e.g. Your google account details can be used to authenticate access to Google Drive using Google drive connector, and Google Sheets using it’s connector. In this example same account is being used across multiple connectors and their connections.
Datasets (DS): A Dataset contains all the rows and columns of the data fetched from a connector into Gathr Analytics by running an operation.
For example, if you connect with Jira and run operations to fetch All Projects, Issues, and Releases, then you will get three Datasets (DS) in your Editable App. The schema of each DS may be different, as in our example rows and columns of DS containing All Projects will be different from that containing All Issues.
You can have multiple visualizations on a dataset and place them on pages of an Editable App.
The following image shows three datasets in the Data Panel. It also shows several visualizations created on the current page from the ‘Issues’ dataset.
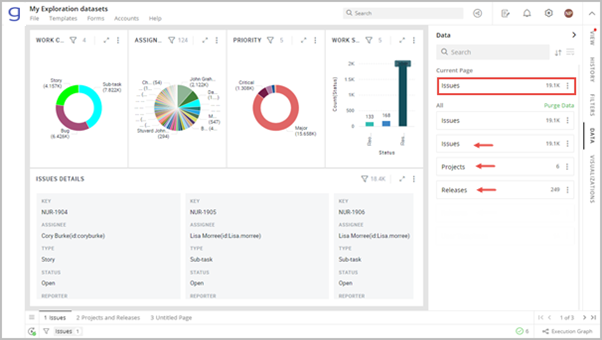
Datasets
Dataset Type (DST)
As explained above, a DS is a collection of rows and columns. A Data Set Type (DST) is the schema of a DS. DST will define properties of a dataset, such as Column Names/Ids, Column data types, Constraints on those columns (e.g., Primary Key) etc.
You can have multiple DS of the same DST in your Editable App. Two DS are of the same type if their DST is the same.
Basic Data Type
Each column of a DST has a property that defines the type of data (Number, Text, Date etc.) stored in the column. This is called the Basic Type of the column.
Business Type (BST)
A column can Additionally be assigned a Business Type (BST) by the Author. The BST of a column defines the business meaning of the column. This helps Gathr Analytics correlate different columns having the same business meaning. For example, “Assignee” and “Reporter” columns in “Issues” dataset are 2 different columns but can have a common business type to indicate that both contain Jira’s User Ids.
Note: Context Sensitive Menu shows the relevant operations based on both Business Type and Basic Type of the selected data.
Templates
While authoring an Editable App, you fetch data from connected Connectors, perform computations and analytics, and create various visualizations on this data. If you want to do these steps again, Gathr Analytics provides a quick short cut to regenerate all these steps without doing them individually.
You can create a reusable Template from an editable App. A template stores operations, computations, visualizations (but no data) of the chosen pages of an Editable App. In other words templates store the logic and visualization.
Once a template has been created, you can use this template in an Editable App, to replicate the same steps on a new DS of same DST.
Suppose you want to analyze Jira issues. You have done the analysis, computations, and created visualizations on issues data. Now you can save this analysis as a Template. You can use this Template on Jira issues of another project and rapidly perform Jira Issue analysis.
To learn more refer - Fetch Data From Connected Tools.
Visualizations
Visualizations are the graphical representation of data so that you can interpret and analyze it. Visualizations help you visually identify trends, patterns, outliers in the data.
Gathr Analytics offers a wide range of visualizations like Pie, Bar, Line, Tree map, Network Graph, Gantt chart, Word cloud to name a few.
The following image shows some sample visualizations available in Gathr Analytics.
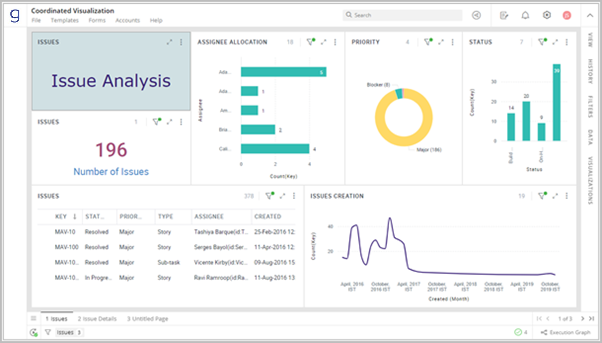
Visualizations
To learn more about creating visualizations, refer to section- ‘creating a visualization’.
Containers
A Container is the rectangular box that contains the visualizations (Grid, Pie, Bar, etc.) You can have multiple Containers on a page. A Container can be repositioned on or across page by holding the Container’s header, and drag-drop gesture.
To delete a Container, select it and press the Delete key.
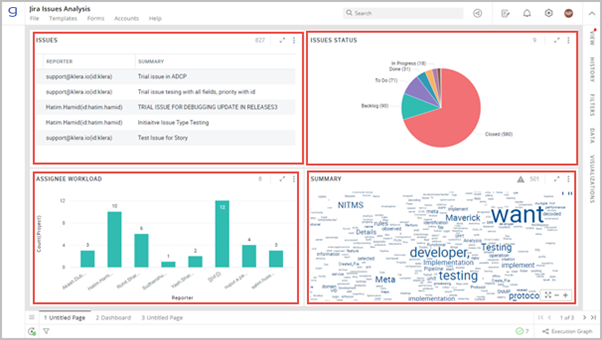
Containers
You can rename a Container by clicking on the ‘Pen Icon’ shown when you mouse hover on the Container’s name.
Click  to maximize a Container and click
  to restore back to its normal size.
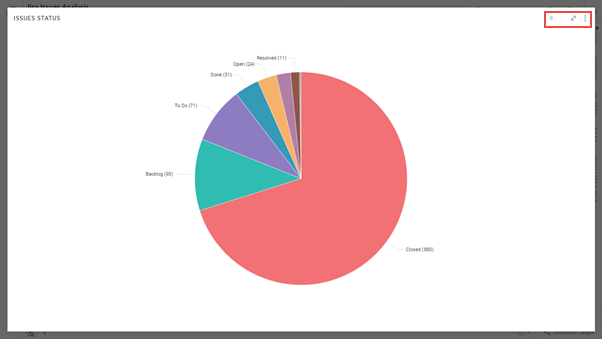
Container maximized
View Panel
In your Editable App, after you perform an operation that generates data, View Panel slides in from the right and lists the resulting datasets and Templates applicable on this data.
You may drag-and-drop the datasets and Templates to bring them on an existing page or double-click on it to bring it on a new page.
You can remove entries from the View Panel by clicking on or remove all entries by clicking on
 in the panel.
Search for the operations by typing in this
 box.
box.
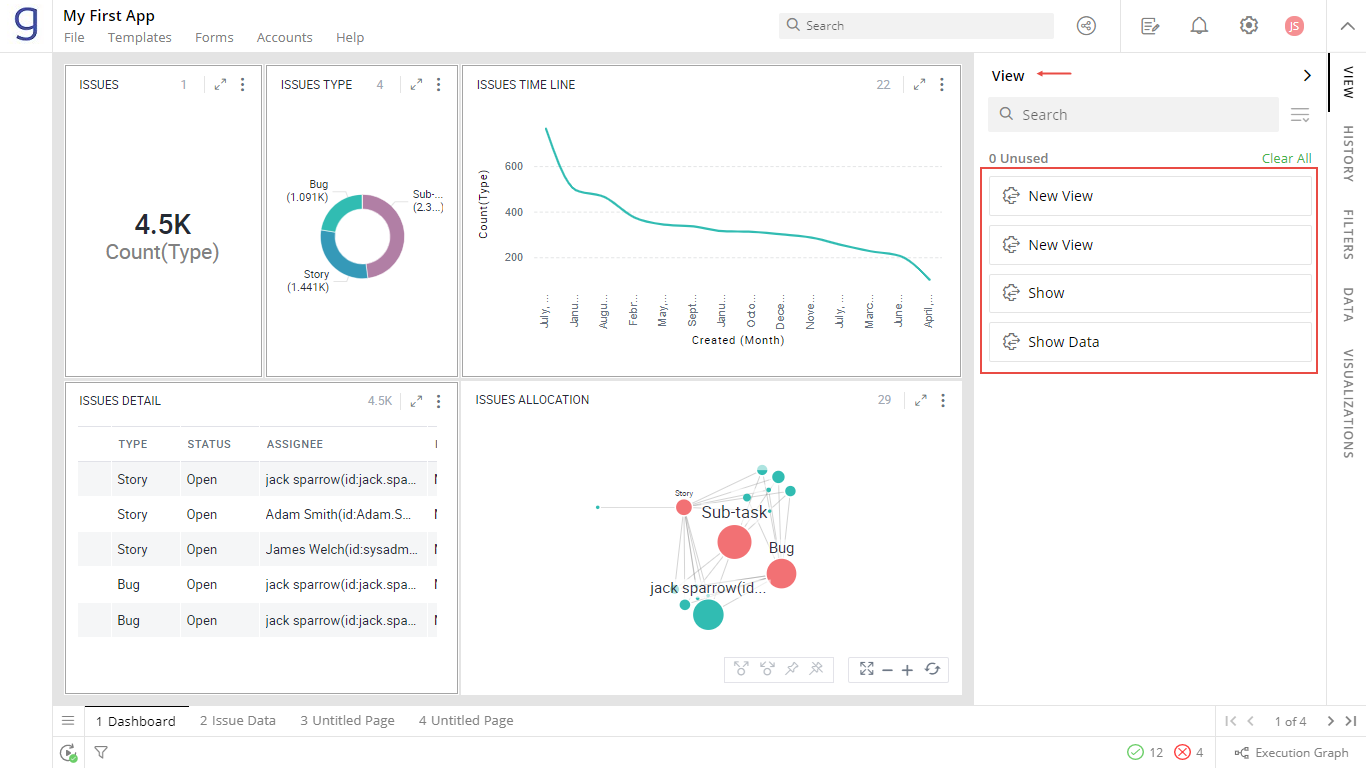
View Panel
History Panel
History panel displays the list of all the operations performed in the Editable App in time order (Latest at top).
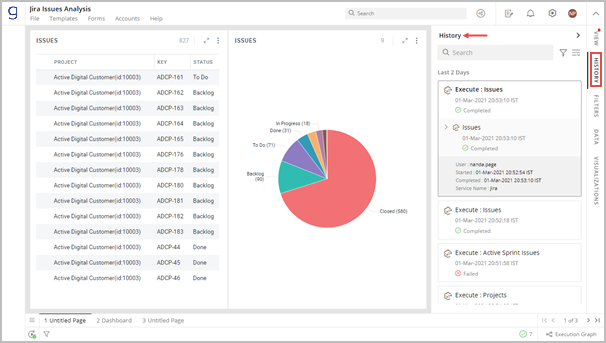
History Panel
To learn more, refer to section- ‘View Operation Execution History & Graph’.
Filters Panel
To filter data of all the datasets present on the current page. The Filters Panel lists all the columns of all the datasets present on the current page. You can also see the currently applied filters here.
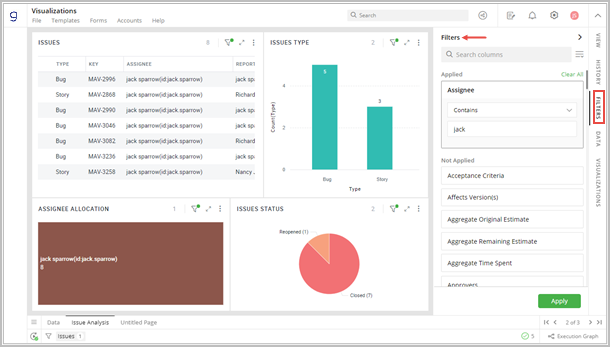
Filters Panel
To learn more, refer to section- ‘Apply Filters’.
Data Panel
It lists all the datasets (DS) present in the current Editable App. You can perform various actions on these Datasets e.g. create formulas, apply alerts etc.
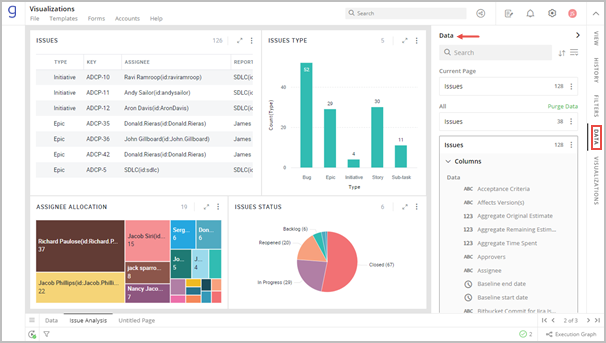
Data Panel
Visualizations Panel
The visualizations panel lets you configure the visualization selected on the floor. Please note that visualization panel always opens with data panel, as you may need to drag and drop some columns from data panel on visualizations panel.
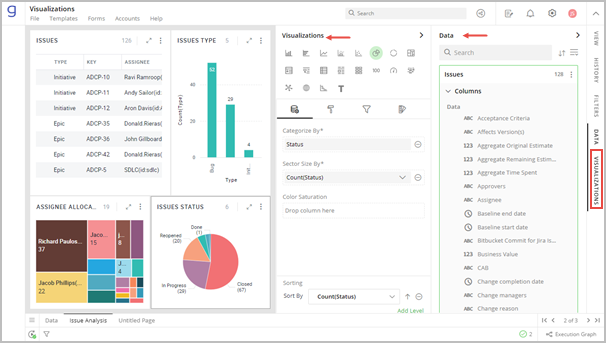
Visualizations Panel
To learn more, refer to section- ‘creating a visualization’ .
Left Panel: Left Panel is the space where you can drag and drop a container from the Floor, and it will remain there even when you navigate across tabs/pages.
Note: Input forms are usually open in the Left Panel.
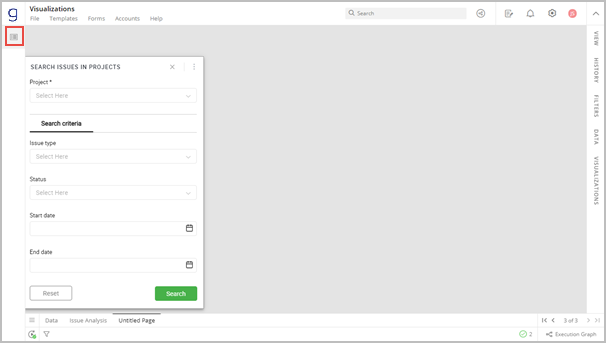
Input Form in the Left Panel
If you have any feedback on Gathr documentation, please email us!