Audit Trail
Audit Trail captures and presents all important activities and events in the platform for auditing.
Interaction events include login details, actions performed on application feature, user profile updates and all other interactions possible within Gathr.
Audit Trail provides features to search, view and filter user interaction events in graphical and tabular formats.
There are two modes of searching an event, Basic and Advanced.
Basic Search
Events can be searched by providing required parameters inside filter menu on top of Audit Trail page. The search results returned are from all the entities and from all types of operations.
Filter options that are available in a basic search are listed as follows:
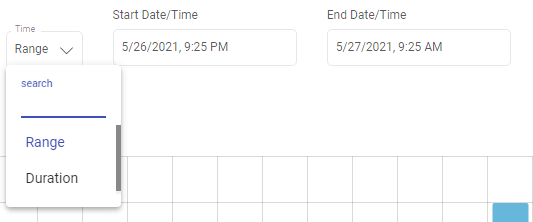
Time Range search
Time Duration search.
Full Text Search
Keyword Search
Time Range Search
You can provide time intervals by setting Start Date Time and End Date Time filters to get those event interactions which were performed in the specified time range.
Default value is 12 hours ago from the current system time.
After selecting the start or end date/time, click on the Set button for it to reflect the selected date/time.
Duration Based Search
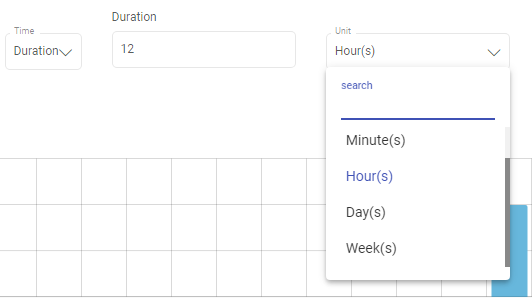
Select Duration option for defining time intervals. Provide duration as integer value with desired time unit. Default duration value is 12 and unit is hours.
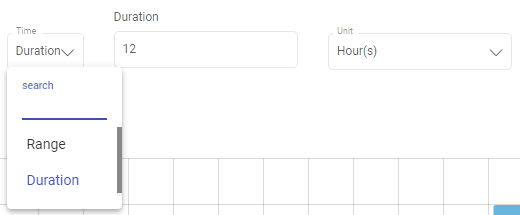
Possible units are minutes, hours, days and weeks.
Full Text Search
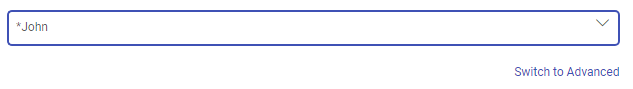
To search events based on keyword or pattern, use full text search filter option.
Use wildcard (*) to create pattern or provide exact value. System will search events by matching all field values of record.
Keyword Search
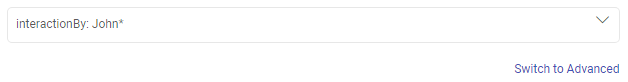
To perform search on any of the field value of the event record, use colon based pattern.
Example:
interactionBy:John*, where, interactionBy is one of the field name of event record which specifies the user name who performed that event and John* is value of field interactionBy.
Possible field names which can be used to perform Keyword search are as follows:
description: Descriptive message about the event interaction.
entityName: Name of the entity on which event was performed, e.g., pipeline name, workflow name, user name etc.
interactionBy: User who caused the interaction event.
operation-Name: The type of action performed on entity, e.g., create, up-date, delete, list, access, share, revoke, etc.
timestamp: Epoch time, in milliseconds, when the event was performed, e.g., 1560369000
Advanced Search
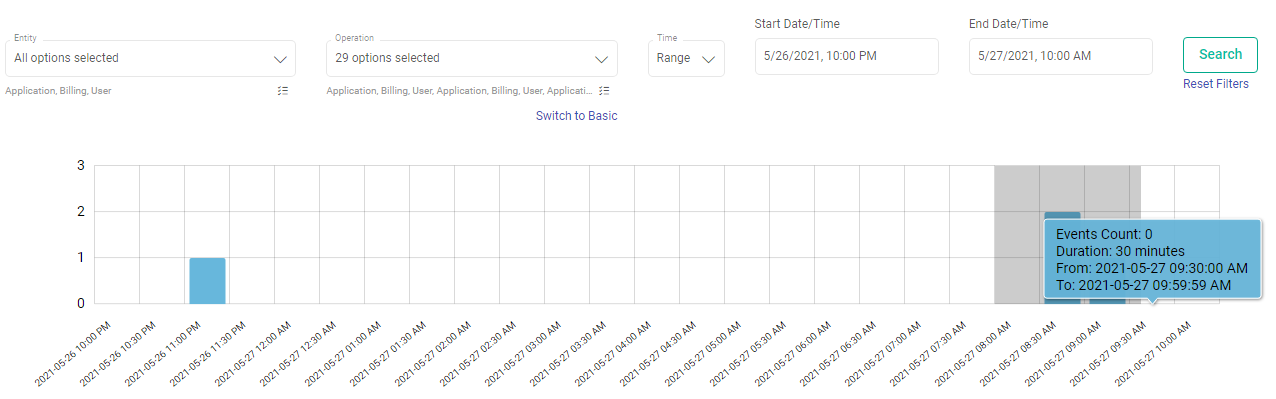
In contrast to the basic full text search, you can perform advanced search where you need to select list of entities and operations on which you want to search the event interactions.
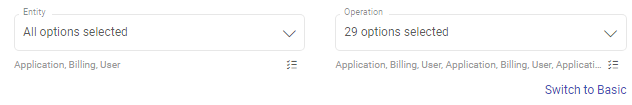
Possible entities and operation types will be listed on Entity and Operation drop-down filters respectively.
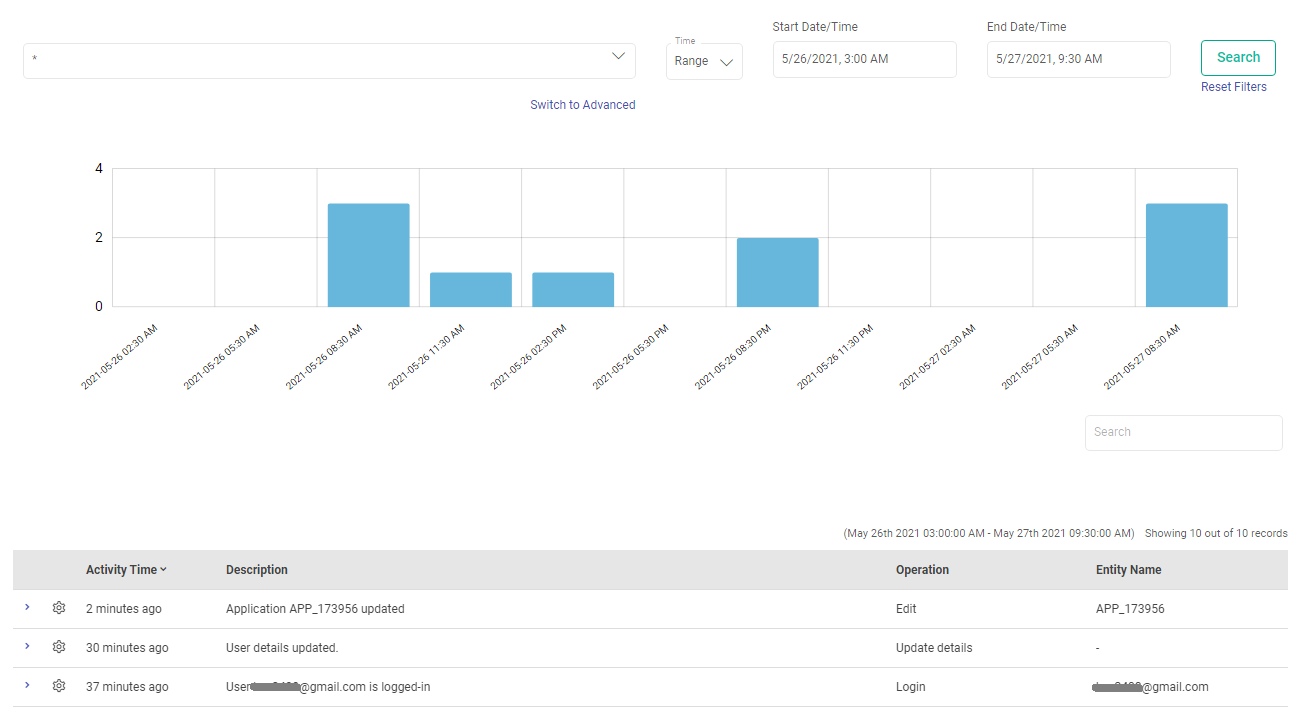
Visualize Audit Results
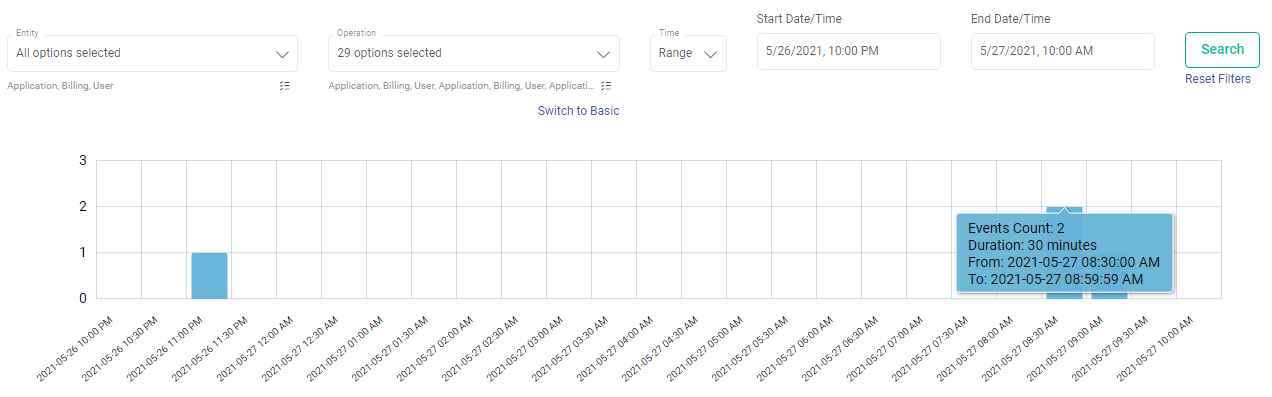
The audit results will appear as events count in a graphical representation followed by list of events in a table based on the search criteria.
Time-Series Count of Events
Time-series graph represents aggregated count of events occurred within given time range. The counts will be shown on time series graph with fixed time intervals. Each interval is represented by graph bar.
Time intervals are calculated based on given time range values in search query. Bigger the given time range, bigger will be the time interval.
Example:
12 hours as input time range will give event counts of every 30 minutes interval. 1 hour as input time range will give event counts of every 1 minute interval.
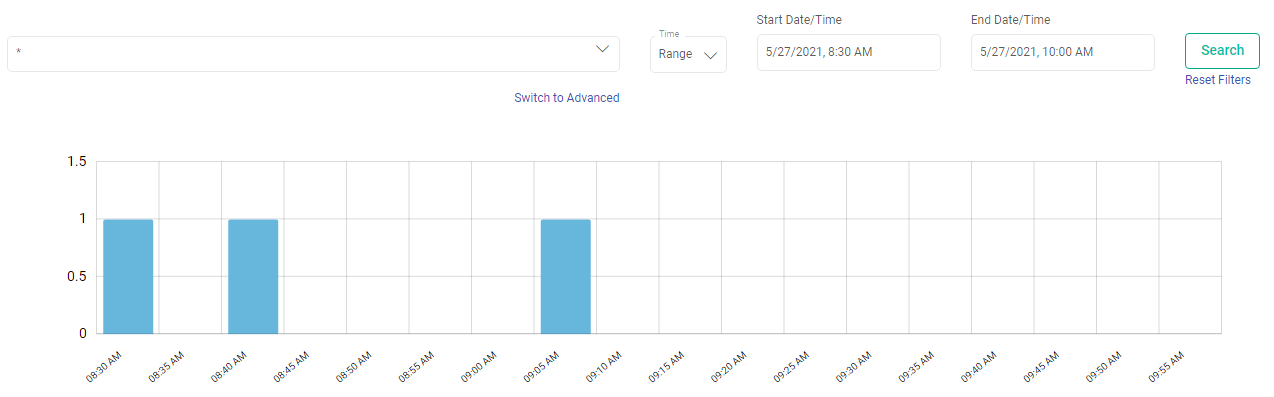
Graph Panning
It allows you to zoom in on a specific area of the graph, which will drill down the graph further and will show the zoomed selected area. New search request will be placed with zoomed time range boundaries.
After panning and zooming the results, the graph looks as shown below:
Processing Search Results
You can do following operations on the search results:
Infinite Scroll
Whenever you scroll down in Result table, next bunch of 100 records will be fetched and appended in result table.
Scroll option has a defined expiry time of 5 minutes after which if no scrolling is done, the scroll window will get expired.
On every subsequent scroll and new search request, scroll expiry time will get reset.
Sorting of Events
You can sort results based on field value of events. A new search request will be placed on each sort action and top 100 (default fetch size) sorted results will be shown out of total matched hits.
Audit Table Glossary
The common terms displayed in the search result table are explained below:
Activity Time: Event time when the event was performed. To see the exact timestamp of the event, expand the result row.
Description: A brief description of the event.
Operation: Operation name which the user has performed. It might be Create, Delete, Update, etc.
Entity Name: Name of the entity on which the event has been performed.
Example: An application created with the name ‘First_ETL_App’ will be mapped as the entity name.
Username: Email ID of the user who has performed the event.
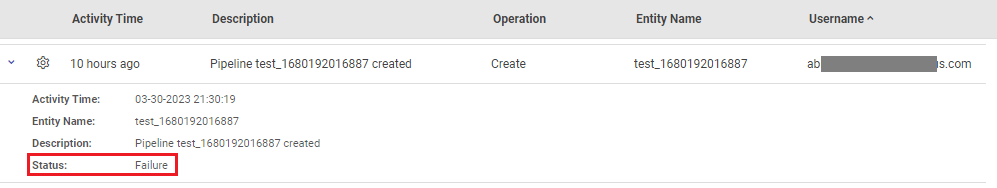
Audit Activity Glossary
Activity Time: Event time when the event was performed. To see the exact timestamp of the event, expand the result row.
Entity Name: Name of the entity on which the event has been performed.
Description: A brief description of the event.
Status: The status of the event performed. The status will be Success, if the event was completed successfully, or, Failure if the event got failed.
Example: An event to create a Pipeline test_1680192016887 was performed, but, it failed.
If you have any feedback on Gathr documentation, please email us!