View CDC Applications
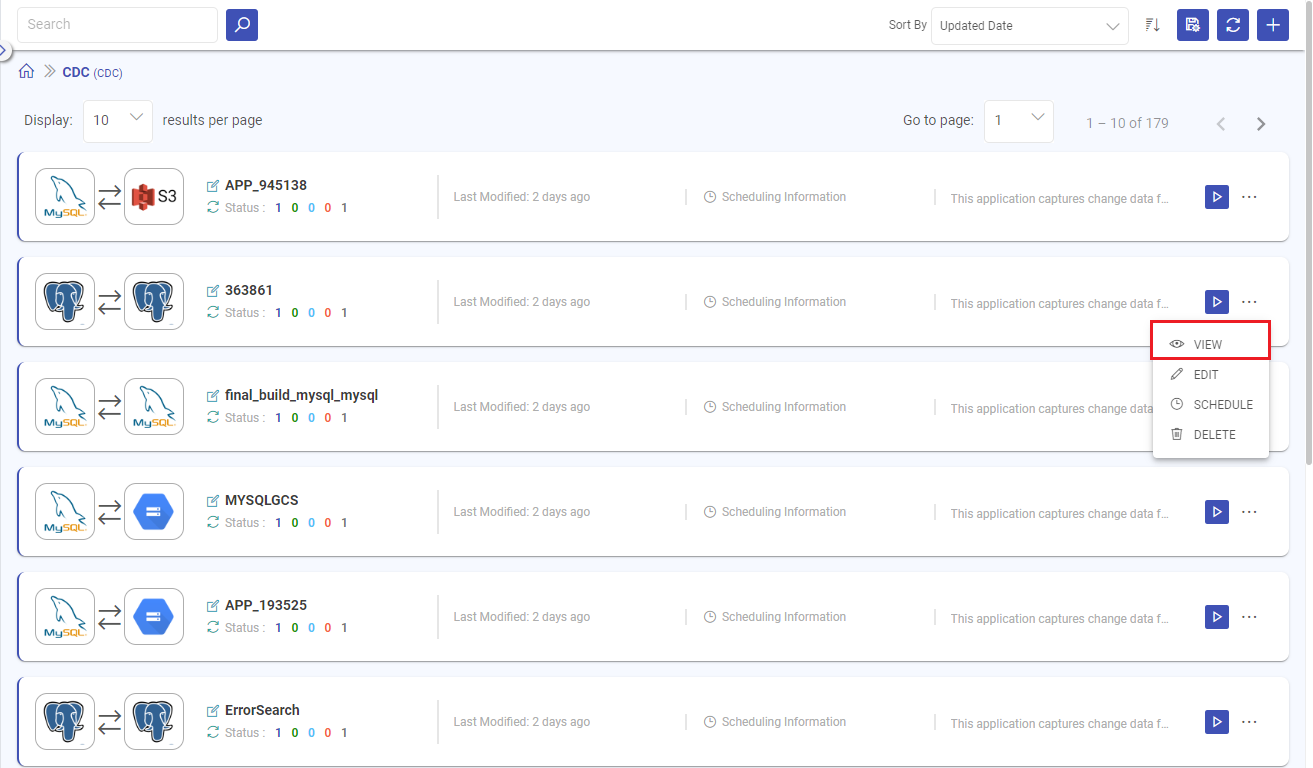
To view details of a CDC application, click on VIEW from its listing page.
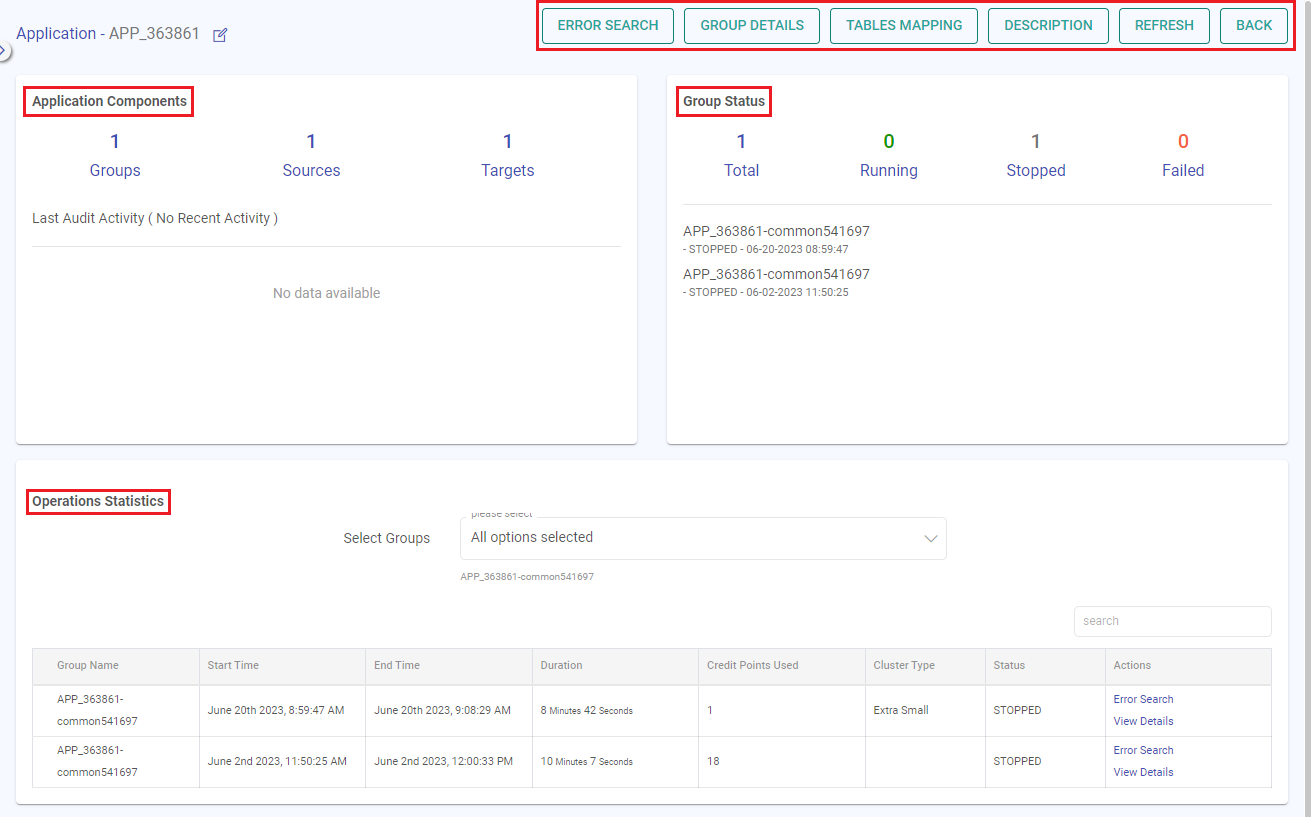
You can find a range of information on the VIEW details page for a CDC application.
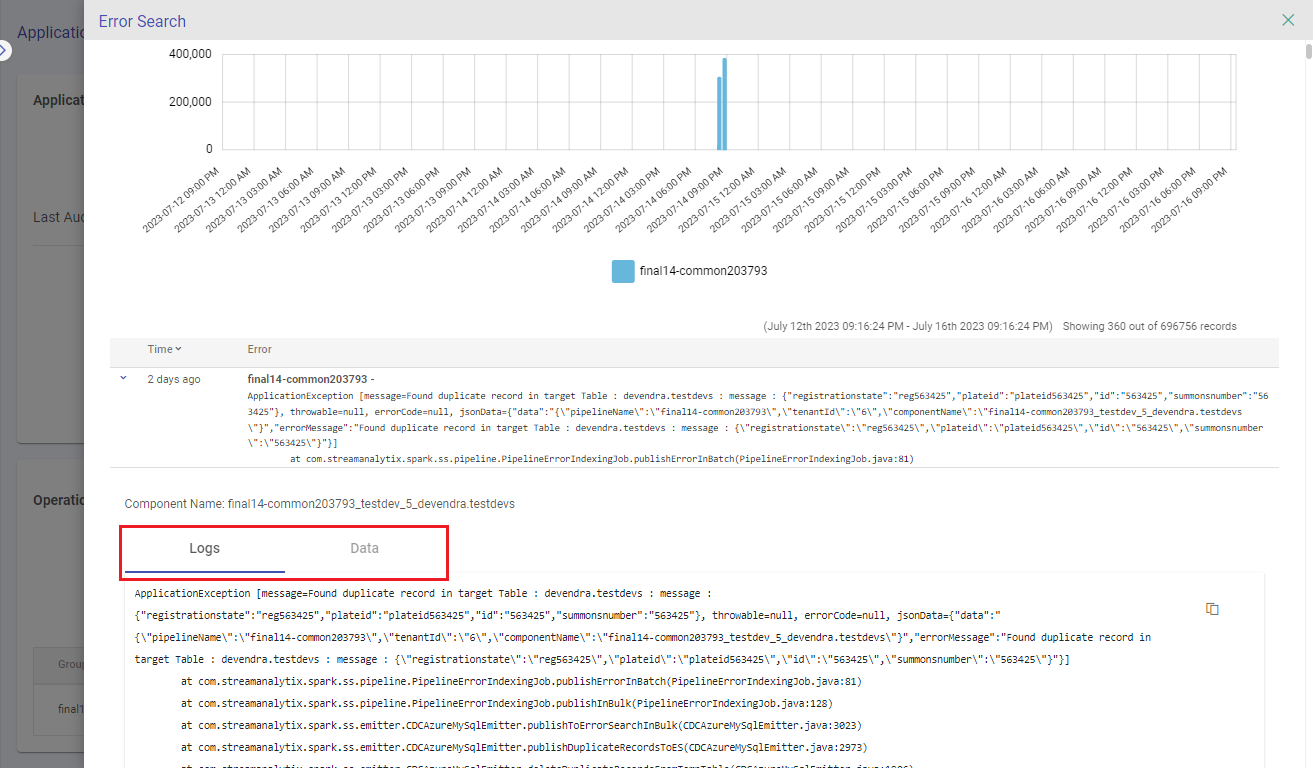
Error Search
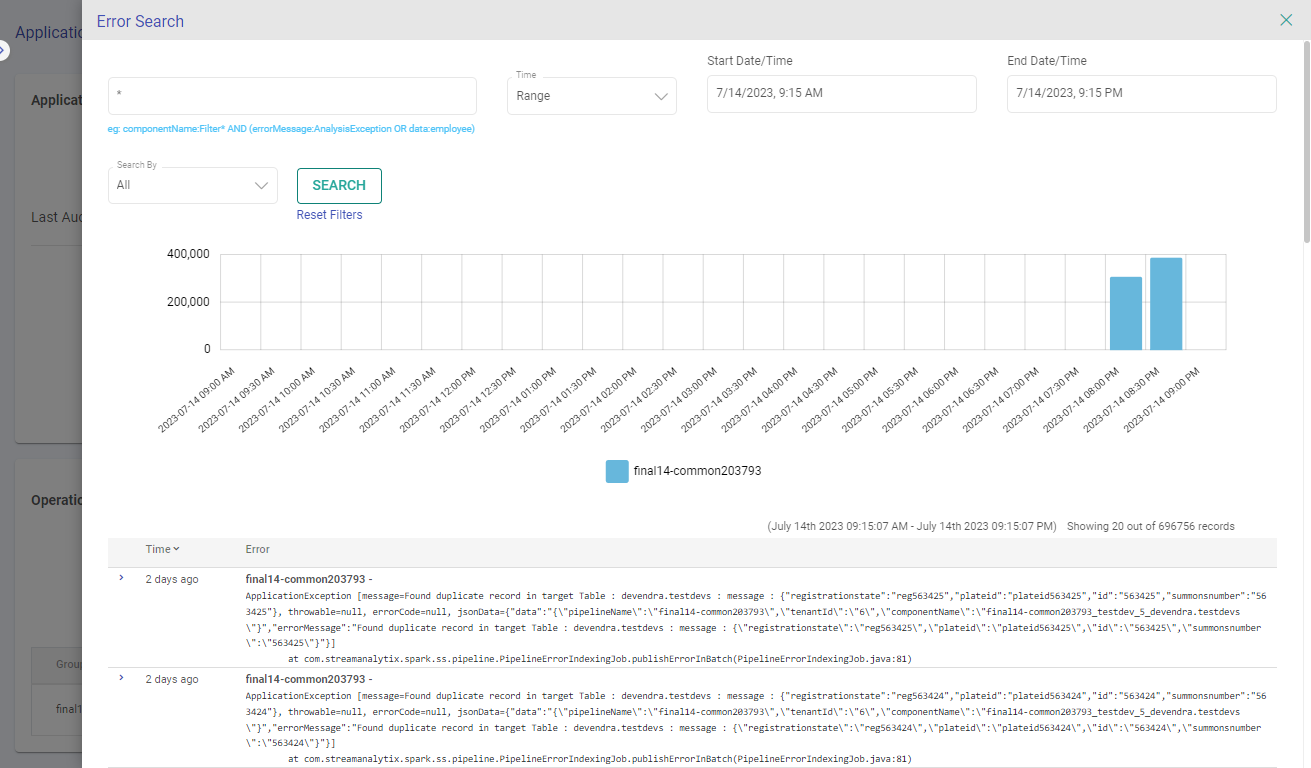
The error search feature can identify erroneous data, pinpoint causes of CDC application breakdowns, and even spot components failing due to specific data.
Additionally, it provides a full stack trace corresponding to any errors detected. Using the error search tab, you can easily see a distribution of errors over time for a CDC application.
This feature also allows you to pan and zoom into a specific time range or duration and display results as a histogram distribution.
Full Text Search
The search bar allows you to do a full text search on certain keywords.
Example: A search for errors associated with data “rubel,25,75000”.
Then a full-text search by entering the keyword ‘rube’ can be done, and it will give you all the errors that have keywords starting with ‘rube’.
Keyword Search
Also, you can do keyword search on following pre-defined fields:
data
errorMessage
Example: errorMessage:de-serialize AND data:rube*
This will give all the errors occurred, where the error contains keyword de-serialize and data containing words starting with rube.
Visualizing Search Results
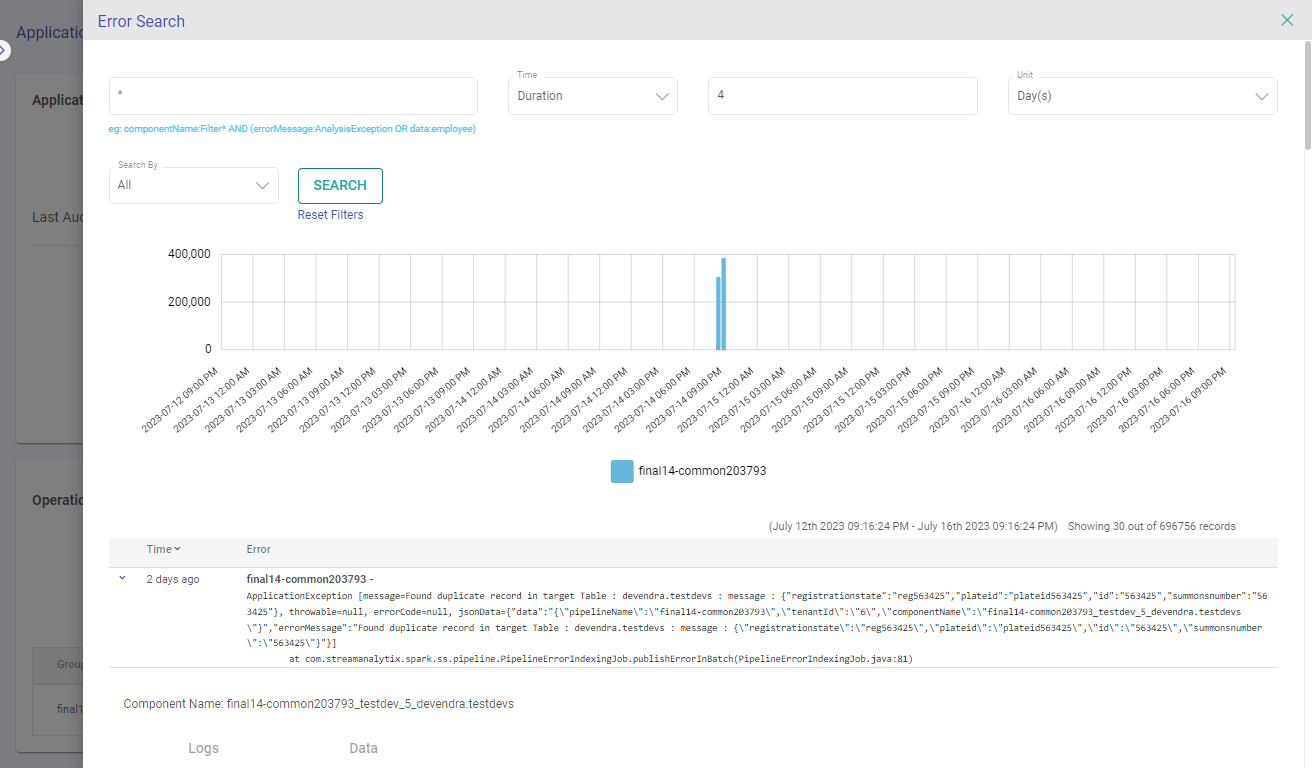
The search bar allows you to search for errors in the pipeline within a time range or by duration. The below graphs shows the visualization of search results.
Error Search by Time Range
Error Search by Duration
Time-Series Count of Events
The search bar allows you to search for errors in the CDC application in a time-series pattern with count of the events. The generated graphs shows the visualization of search results on the graph itself.
Graph Panning and Zooming
Zoom in the graph, by selecting a particular region. New search request will be placed with drilled-down time range boundaries.
Logs and Data
To review error logs and data, expand the desired entry. You can copy the logs and data for future reference and debugging purposes.
Group Details
The Group Details section will showcase the following information:
Group Name: List of all the groups in the CDC application.
Assigned Cluster: The deployment cluster assigned against each CDC application group.
Next Schedule: The next scheduled runtime for the listed group name.

Tables Mapping
The Tables Mapping section will showcase the following information:
Source Table: The name of the source tables will be listed adjacent to each mapped target table.
Target Table: The name of the mapped target tables will be listed adjacent to each source table.
SCD Type: The Slowly Changing Dimension (SCD) that apply to each source-target table mapping will be listed.

Description
In this section, you can view and edit the description you added for the CDC application. Any changes made can also be saved from here.
Refresh
Refresh the page using this option to view the real-time details on the CDC application.
Back
You can return to the CDC applications listing page by clicking this option.
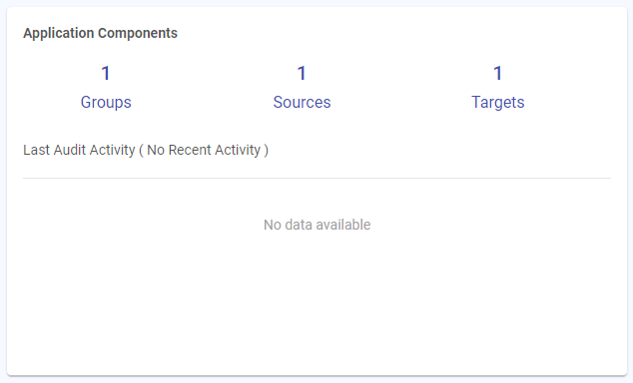
Application Components
The Application Components section displays the count of Groups, Source & Target Tables in each CDC application, including the Last Audit Activity.
Group Status
The Group Status section displays the total Groups count, along with the count of running, stopped & failed groups in each CDC application, including the Last Run Activity.
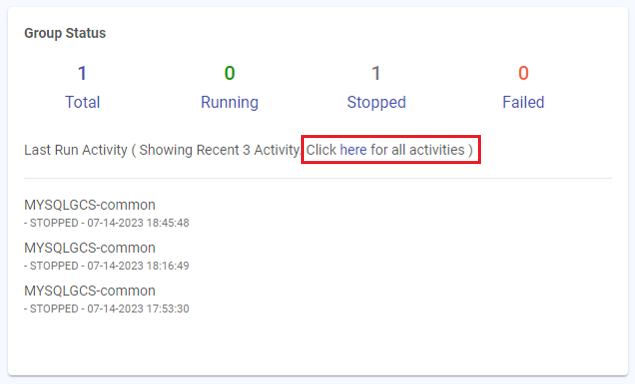
You can click the option to see all activities of a group.
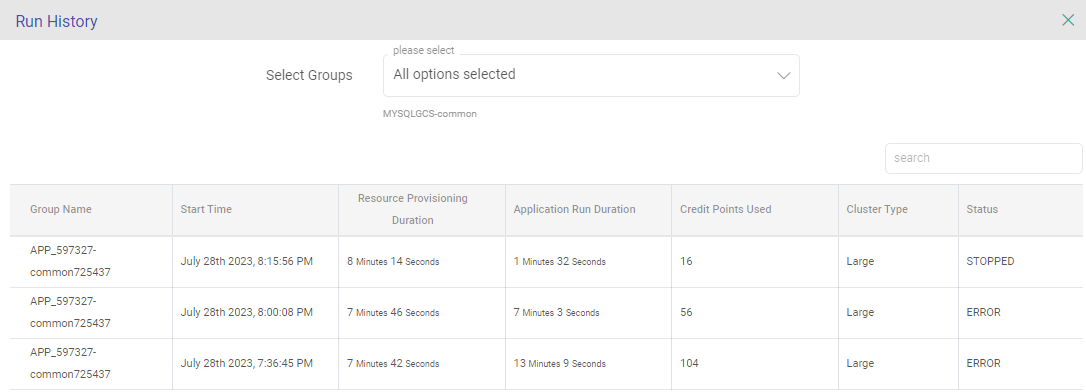
The following details are mentioned for each group’s run history:
Group Name: The group name against which the History Details need to be checked.
Start Time: The start time of the group deployment will be displayed here.
Resource Provisioning Duration: The amount of time it took to assign resources for the CDC application to execute. It is not included in the credit consumption calculation.
Application Run Duration: After the allocation of resources, the duration of the CDC application’s run until its completion is considered its actual run time.
Credit Points Used: The credits consumed for each group run will be listed here.
Cluster Type: The deployment cluster that was assigned to the group will be displayed here.
Status: The status of the groups will be listed here.
Operations Statistics
This section will show the statistics of CDC records count along with the group/table details:
Group: If Listing Type is selected as Group, then the Group column will appear.

Source Table & Target Table: If Listing Type is selected as Tables, then the source and mapped target tables information will appear.

Last Run: The last timestamp when the application was run will appear.
Inserts: The total number of records that were inserted from a source to target will appear.
Updates: The total number of records that were updated from a source to a target will appear.
Deletes: The total number of records that got deleted from the target will appear.
Actions: Option to view results of the CDC application run will appear.
View Results
Graphs for CDC operations allows you to search the CDC app run history.
Search CDC run history by last run
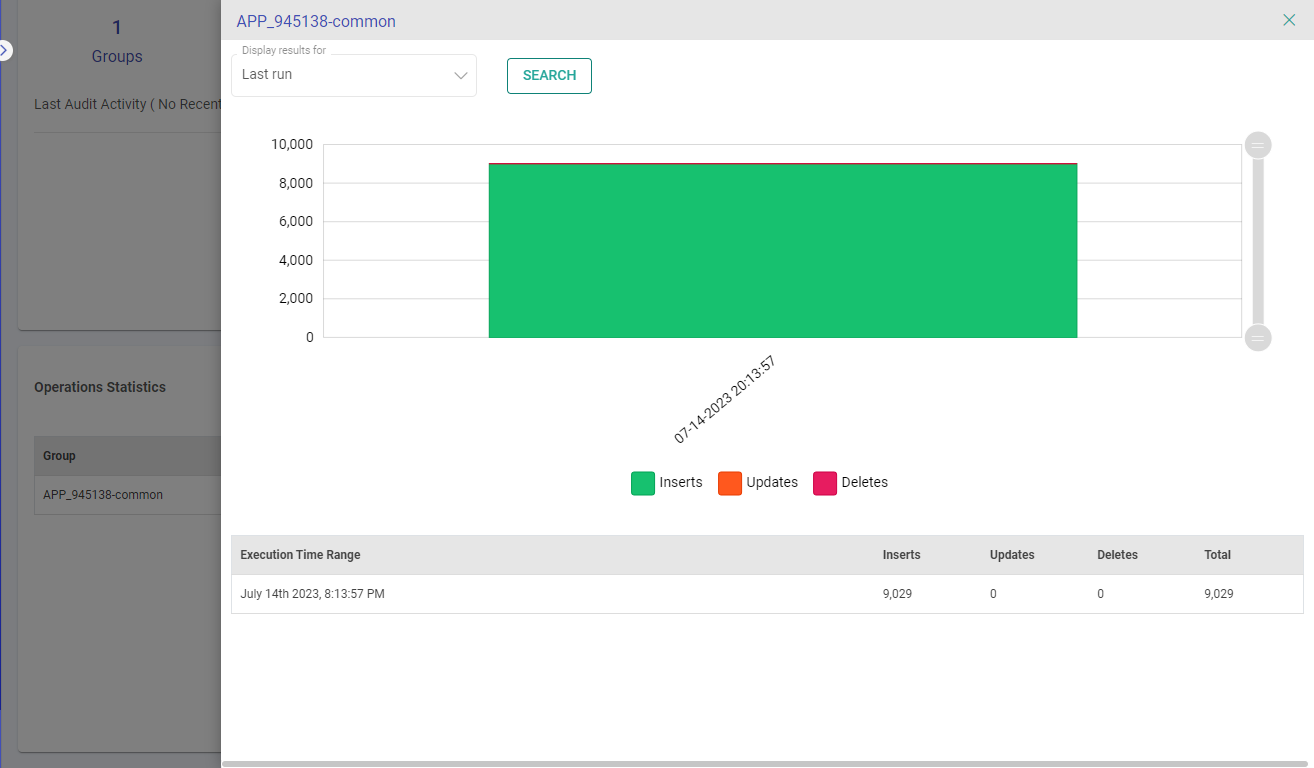
Search CDC run history by all past runs

Each entry in these template types has Group details as the major entity, and upon expanding it, the source and target table details can be found.
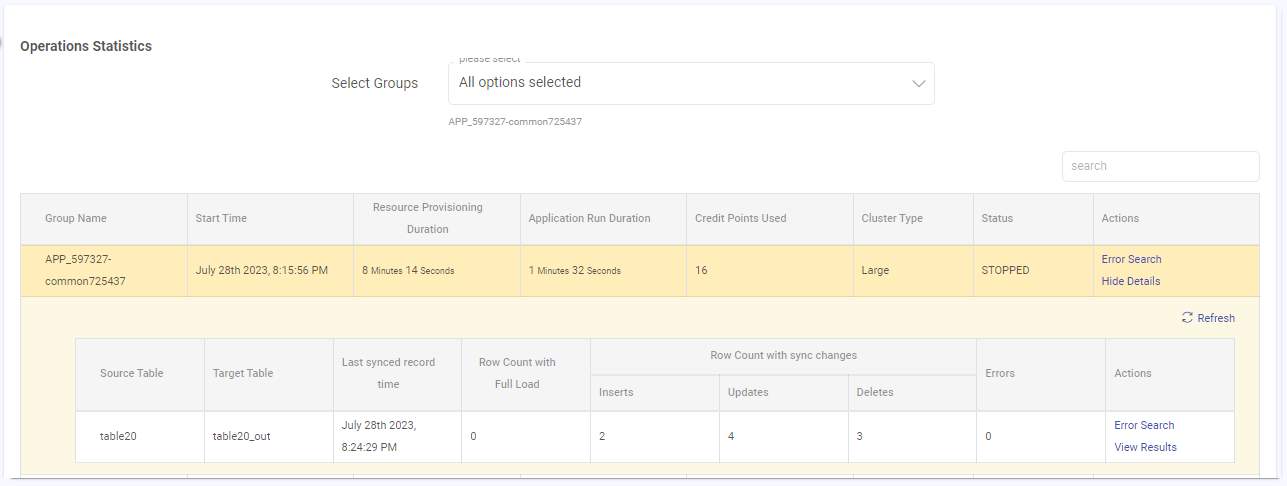
Based on the CDC method selected, the records count will get updated in respective columns.
Actions:
The actions available in the Operations Statistics for the above-mentioned templates are:
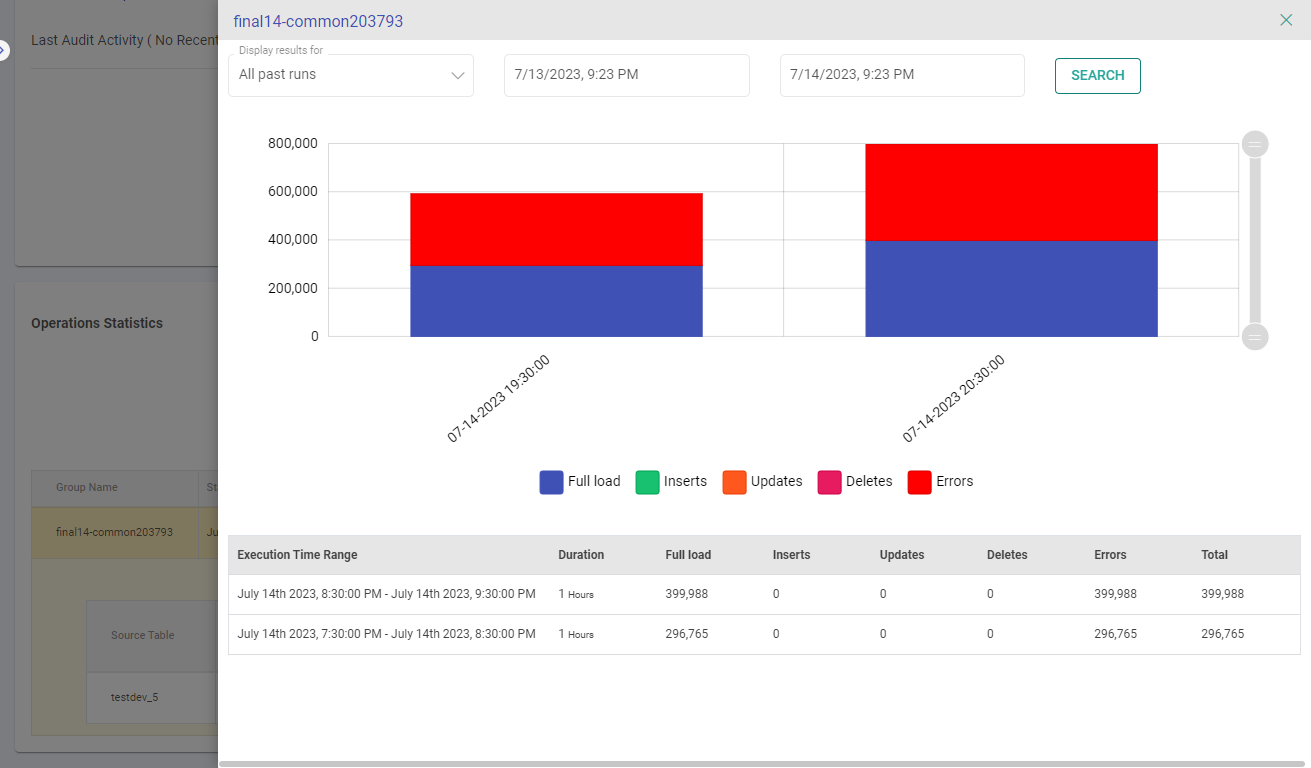
View Results
Graphs for CDC operations allows you to search the CDC app run history.
Search CDC run history by last run
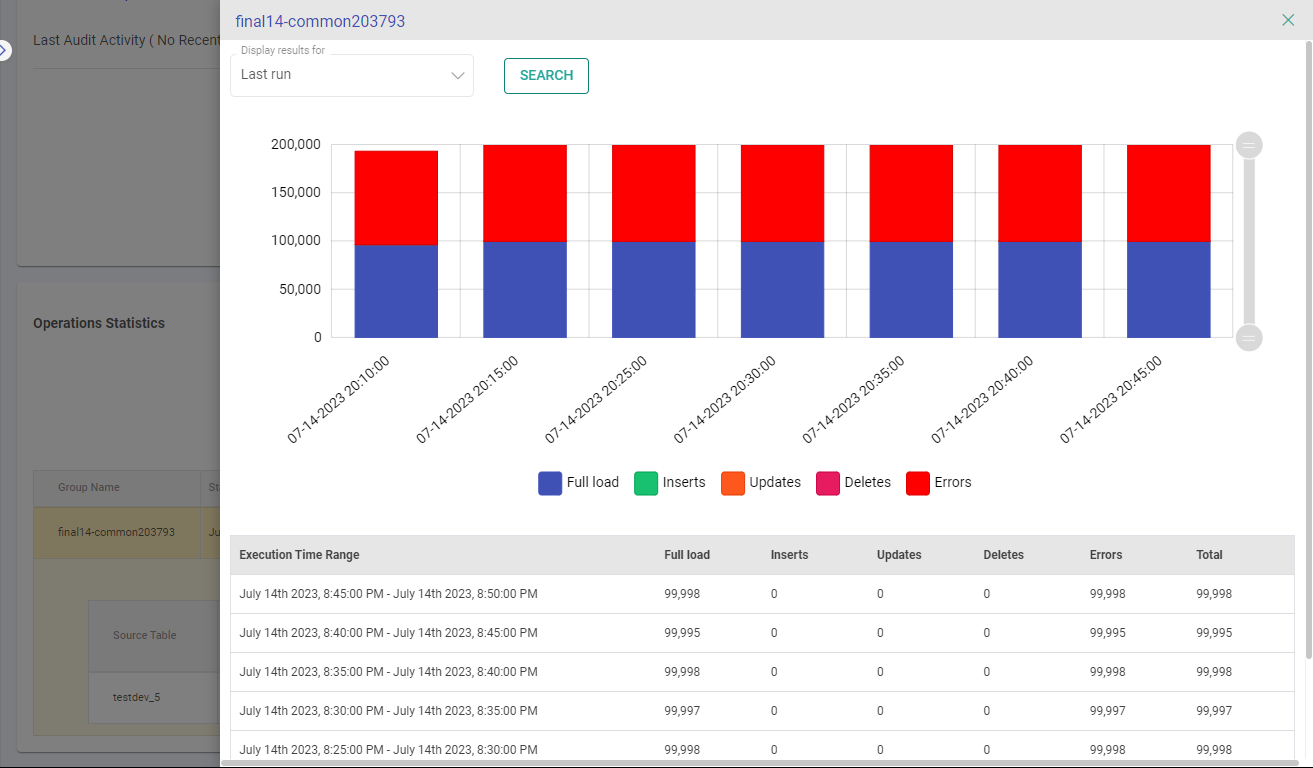
Search CDC run history by all past runs
If you have any feedback on Gathr documentation, please email us!