Visualize Data in Gathr
Gathr is a powerful data-to-outcome platform designed to perform ETL operations and visualize transformed data for informed decision-making.
The Visualize component within Gathr allows users to create intuitive visual representations of their data.
Step-by-Step Data Visualization
Follow these simple steps to visualize your data in Gathr:
Step 1: Add the Visualize Component from Analytics category to an ETL application.
Step 2: Choose source columns for visualization and configure the Visualize component.
Step 3: Preview the draft Visualization on the ETL canvas.
Step 4: Save and run the ETL application.
Step 5: Explore the complete visualization of your data.
For more detailed guidance on each step, please continue reading below.
Step 1 - Add Visualize Component
Create or edit the ETL application you wish to visualize.
Follow the Quick Start with ETL for guidance on ETL application creation.
On the ETL canvas, go to the Analytics section.
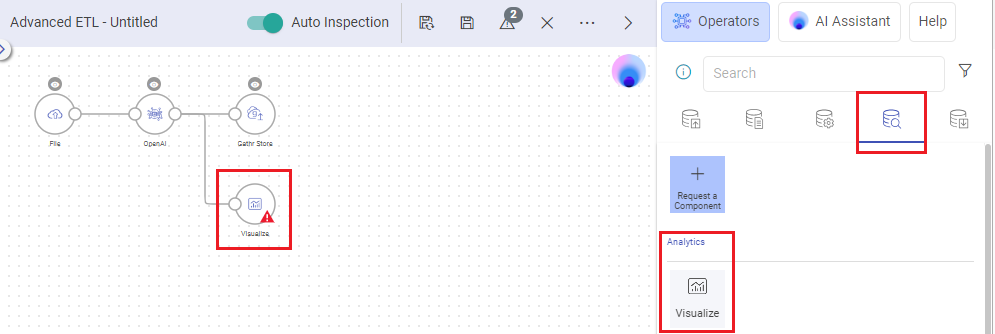
Drag-and-drop the Visualize operator next to the component that has the transformed data to be visualized.
Continue to configure the Visualize component.
Ensure auto inspection is activated to configure/edit the Visualize component.If auto inspection is turned off while configuring or editing the Visualize component, users will be unable to proceed with configuration or editing until auto inspection is enabled.
Step 2 - Select Source Columns to Visualize
Choose source columns for visualization.
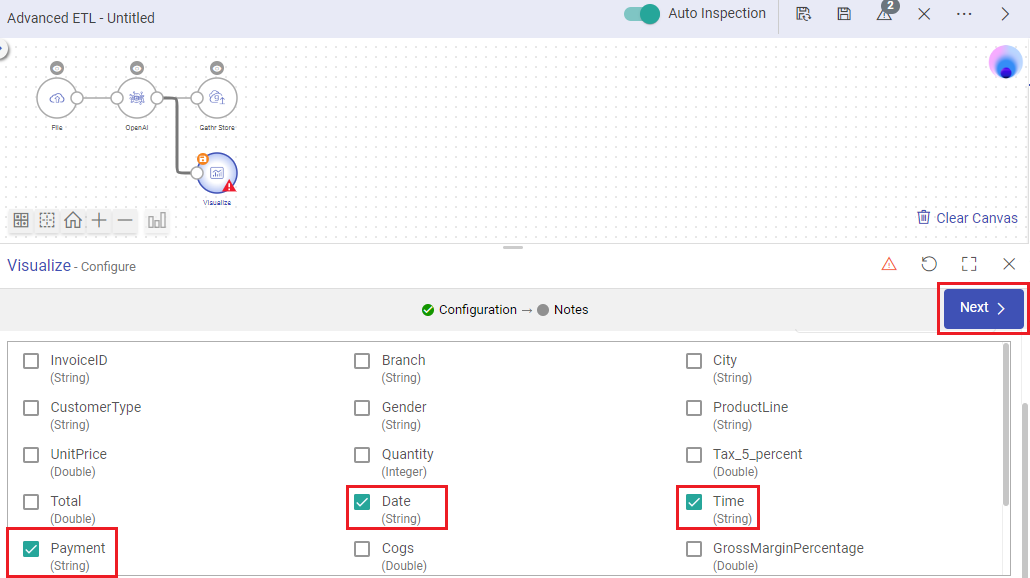
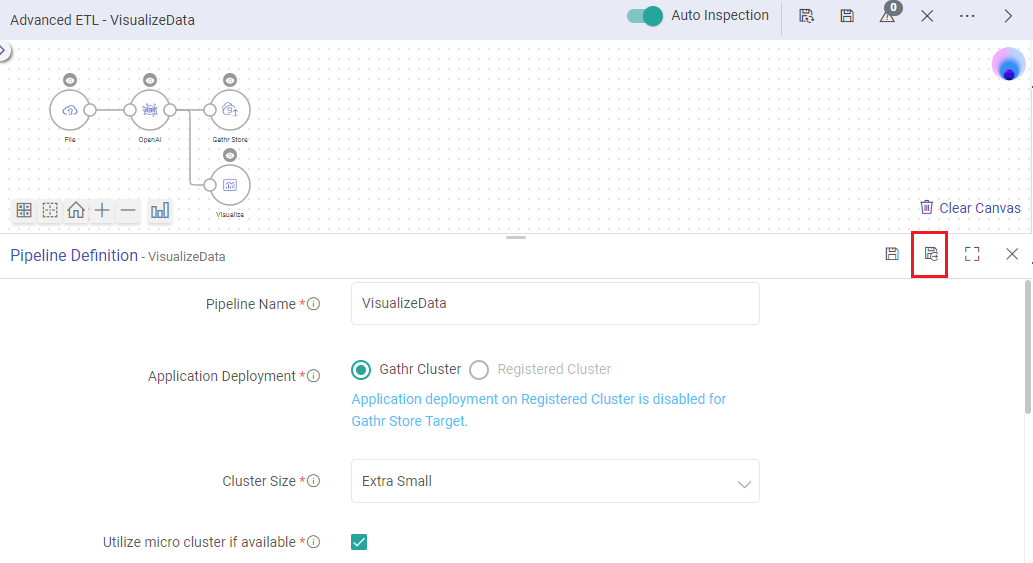
Complete the Visualize component’s configuration.
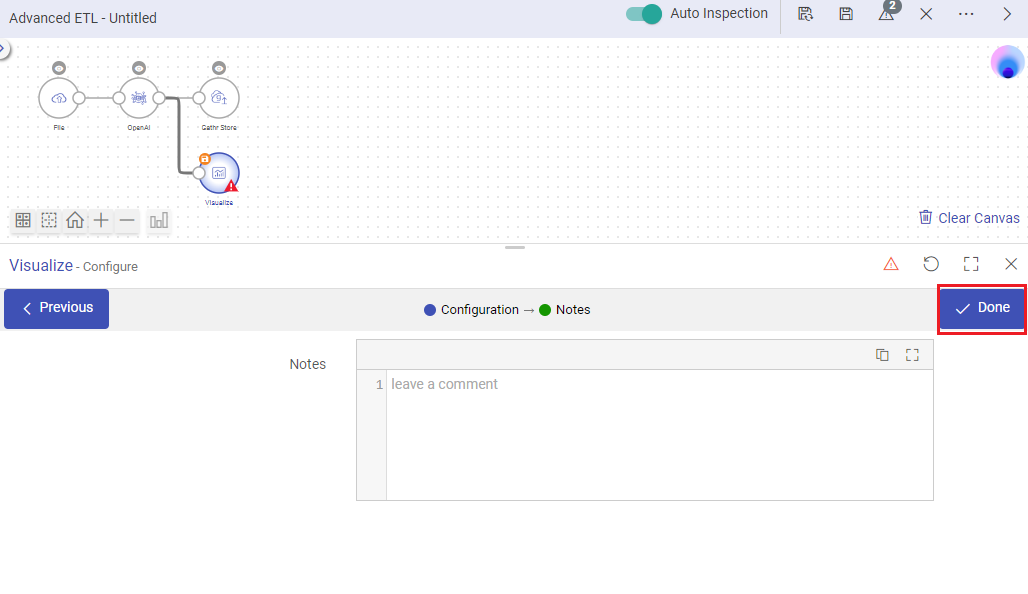 Save-as-Draft condition while using Visualize Component.
The ETL applications with Visualize components will be saved as a draft upon Visualize operator's configuration, preserving components configured up to the Visualize component.
It's important to note that even if the Auto-Save toggle preference is disabled, this condition still applies to ensure the generation of visualizations.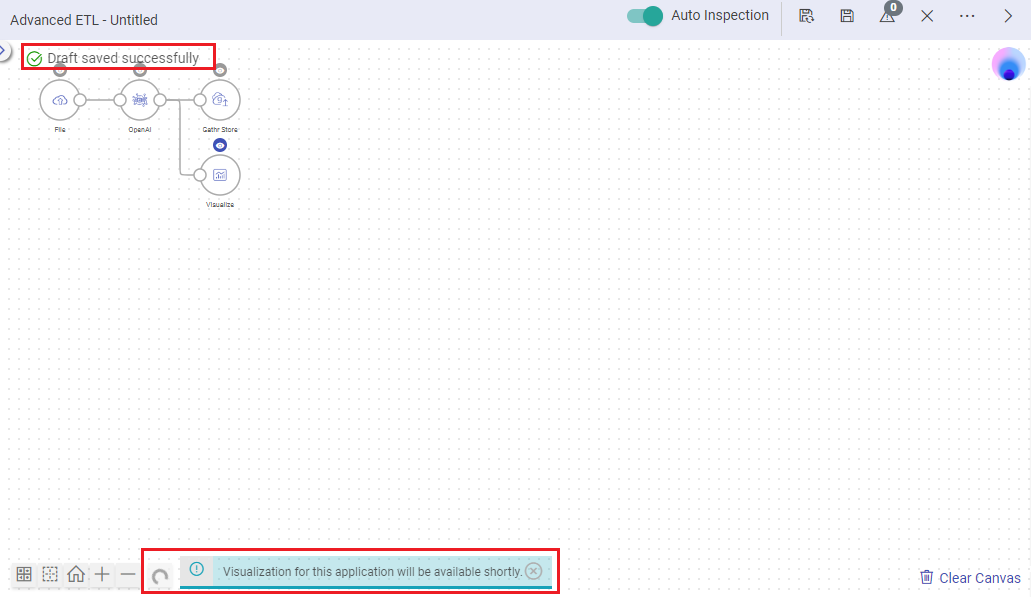
Visualization generation begins immediately upon completing the configuration of the Visualize component.
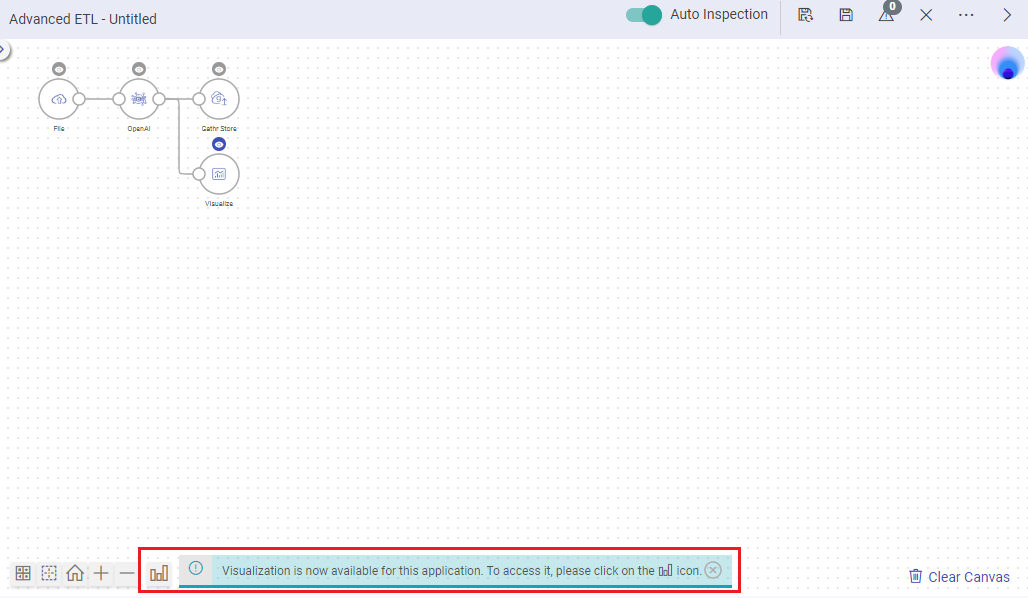
Step 3 - Preview Draft Visualization
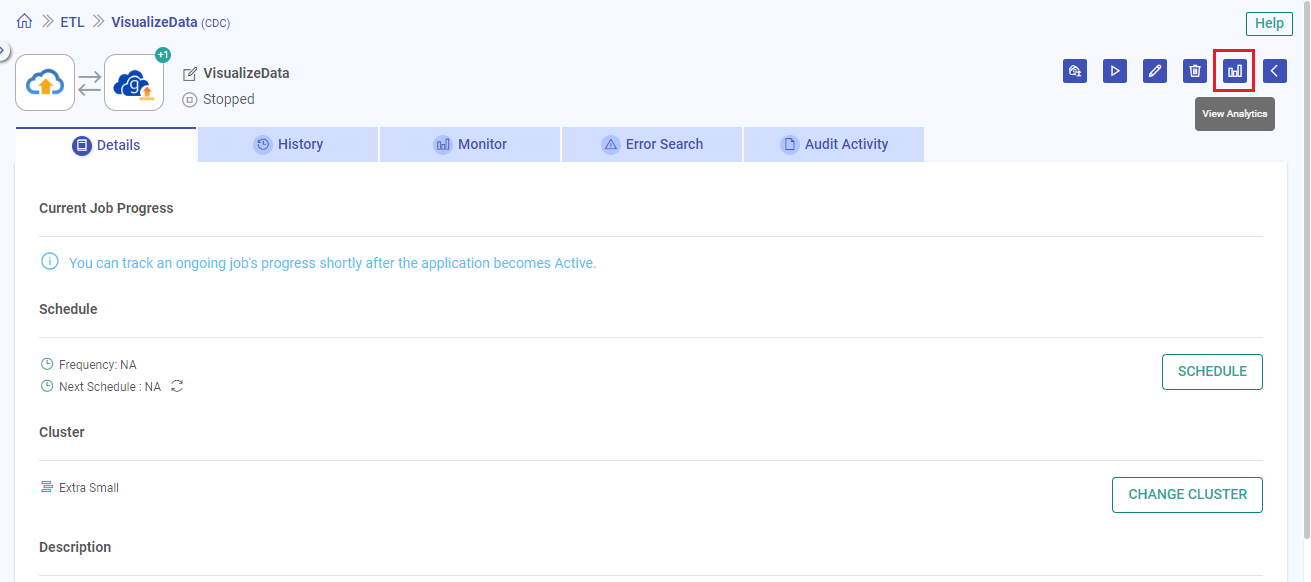
Click the View Analytics icon to preview the draft Visualization on the ETL canvas.
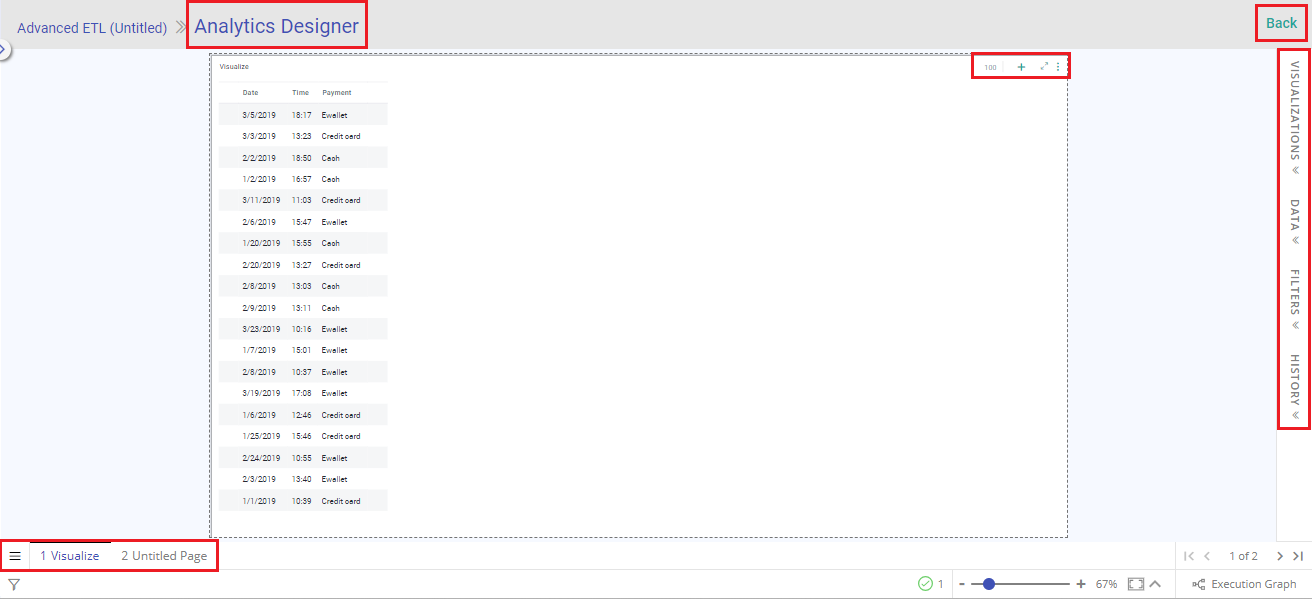
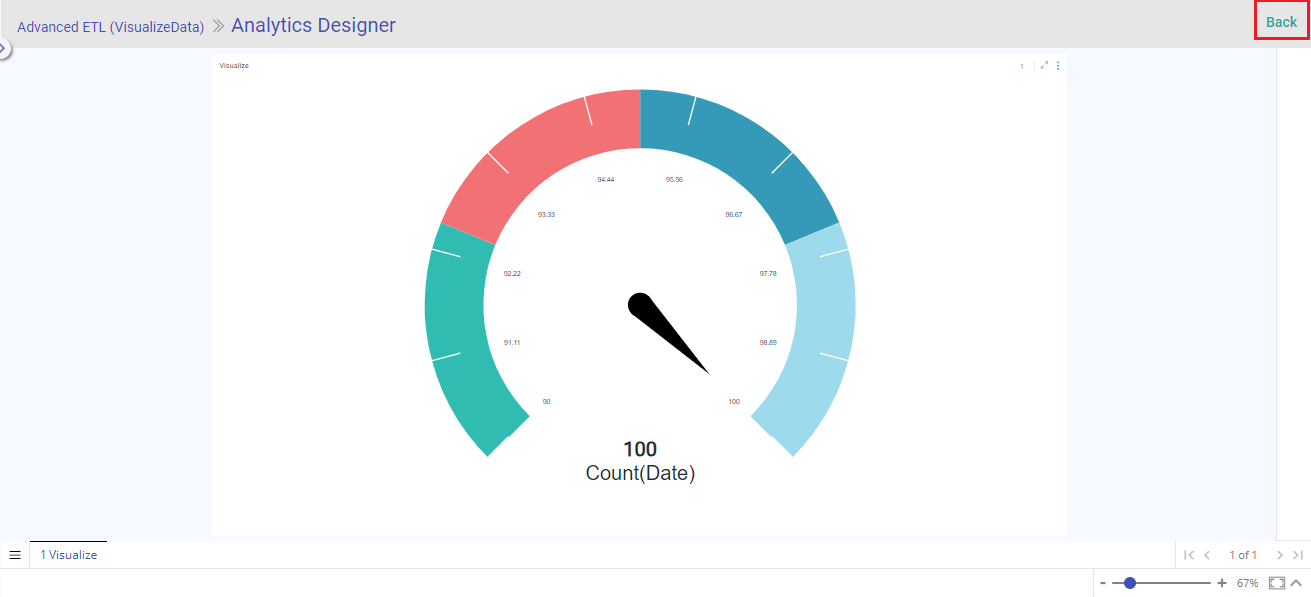
The visualization shown at the time of application design is a snapshot of the overall dataset.
On the Analytics Designer page, open the Visualizations, Data, and other tabs to create new visualizations.
Refer to Create Visualizations Guide for detailed instructions.
Learn about different types of visualizations supported in Gathr here.
Visualizations are prepared with a restricted dataset at design time, limited to the number of records availabe during data preview.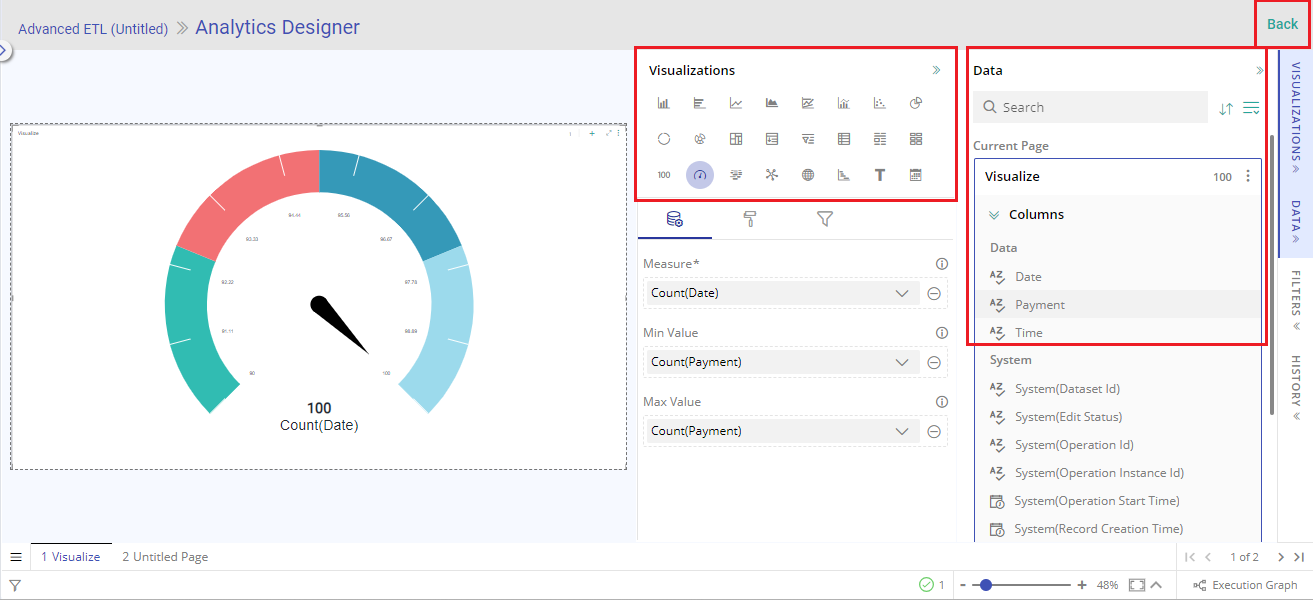
Navigate back to the ETL canvas by clicking on the Back button.
Step 4 - Save and Run ETL Application
Save the ETL application, making it visible on the listing page.
Follow the Quick Start with ETL for guidance on saving and running the ETL application.
Step 5 - Explore Complete Data Visualization
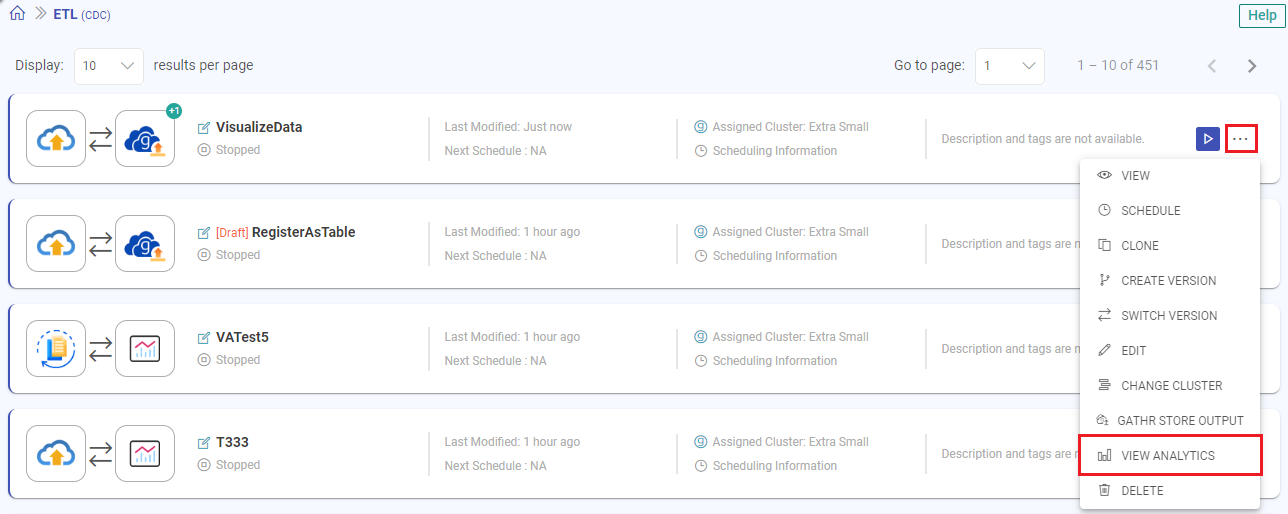
After running the application, you can explore the entire dataset visualization by selecting the View Analytics option from the ellipsis menu in the ETL application.
You can also access the data visualization from the application’s details page, as illustrated below.
Editing on the Analytics Designer page is not possible while viewing the complete data visualization from the listing page. To modify any graphical representations, you will need to edit the relevant Visualize component within the ETL app.
Handling Specific Data Formats for Visualization
Array, Map, and Struct data
To handle Array, Map, and Struct data and enable visualization in Gathr, follow these steps:
Identify Array, Map, or Struct data in your source.
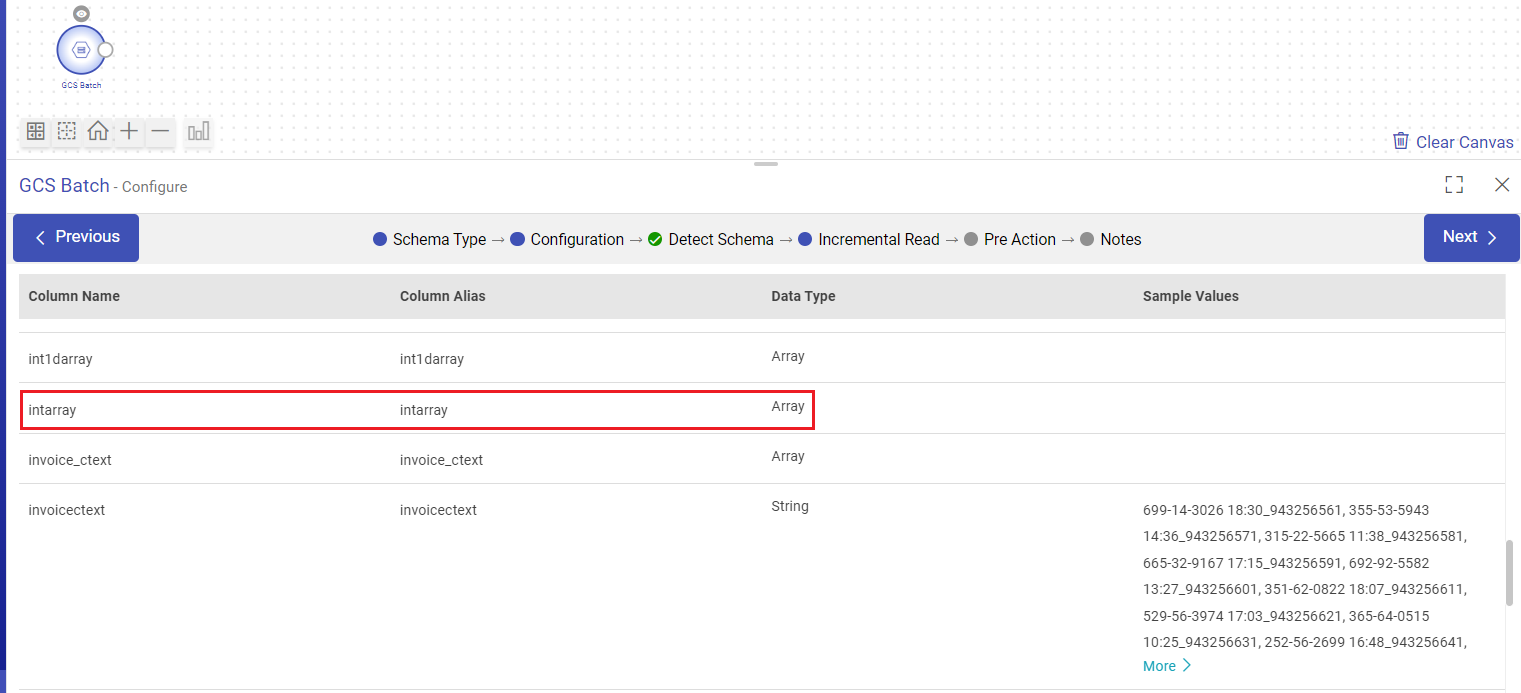
Add an expression evaluator processor, select the column with such data format, and apply
to_json(column)function to convert the Array, Map, or Struct data into a string format.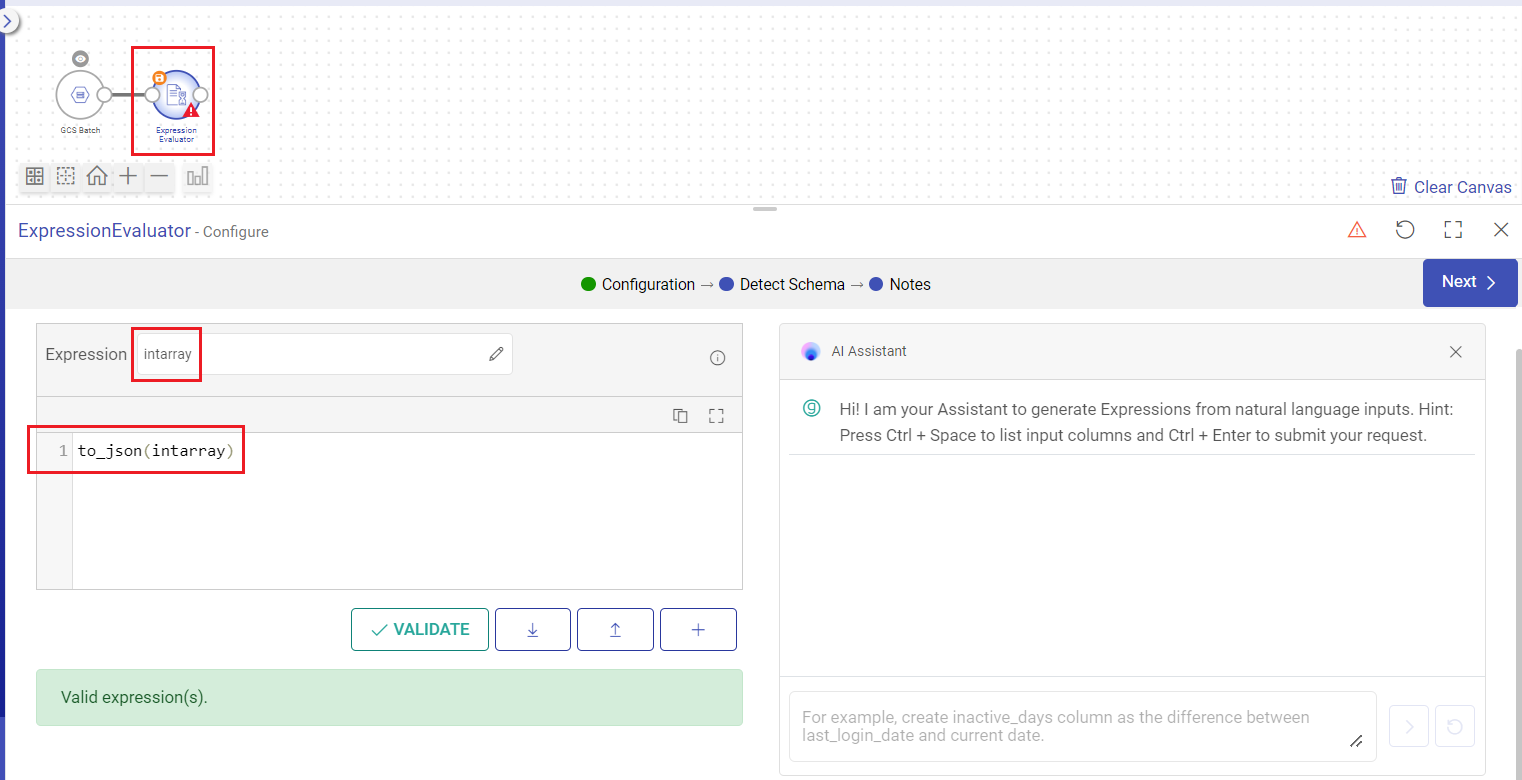
The sample shown below indicates that the Array data has now been converted to a string.
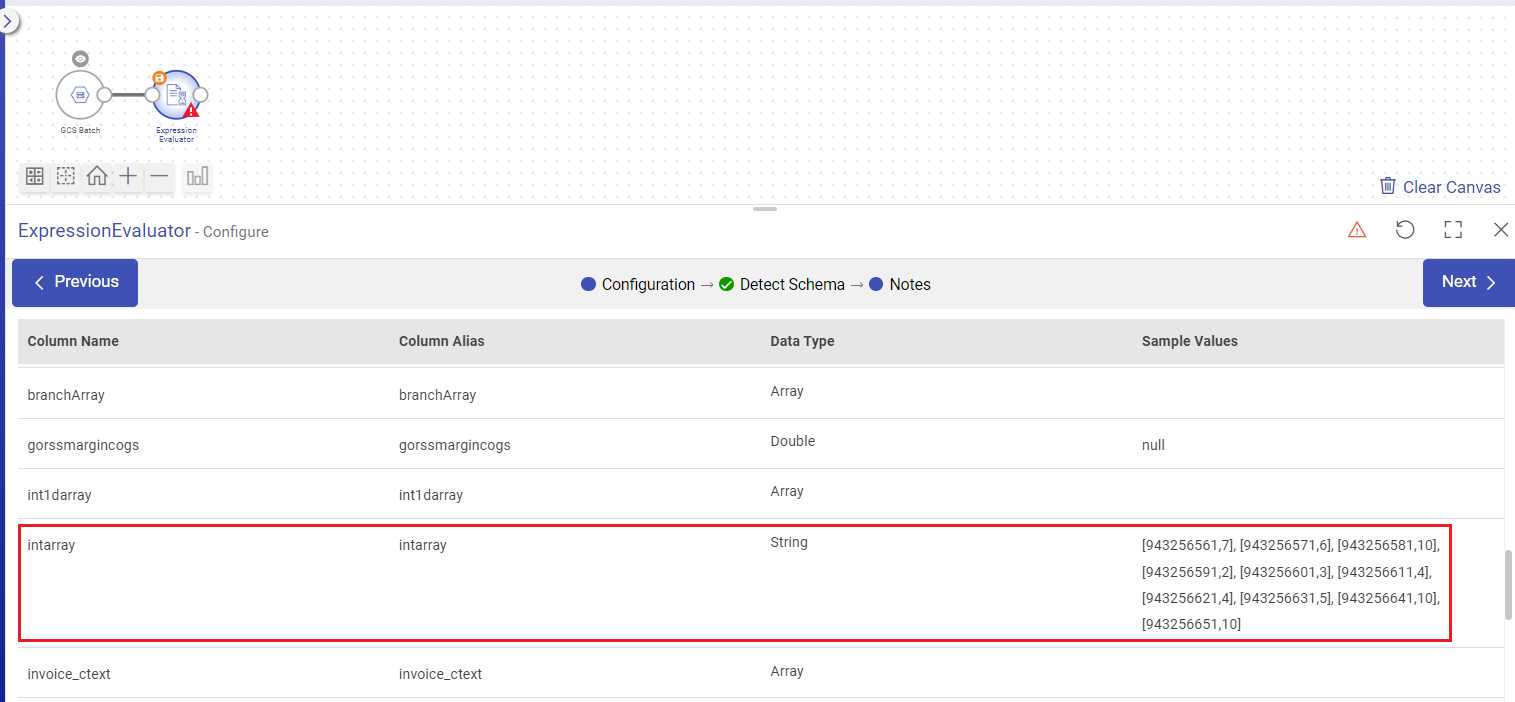
Converting these complex data types into strings enables them to be easily read for visualization.
Add the Visualize component next to the expression evaluator and select the column that now contains string values along with other columns required for visualization.
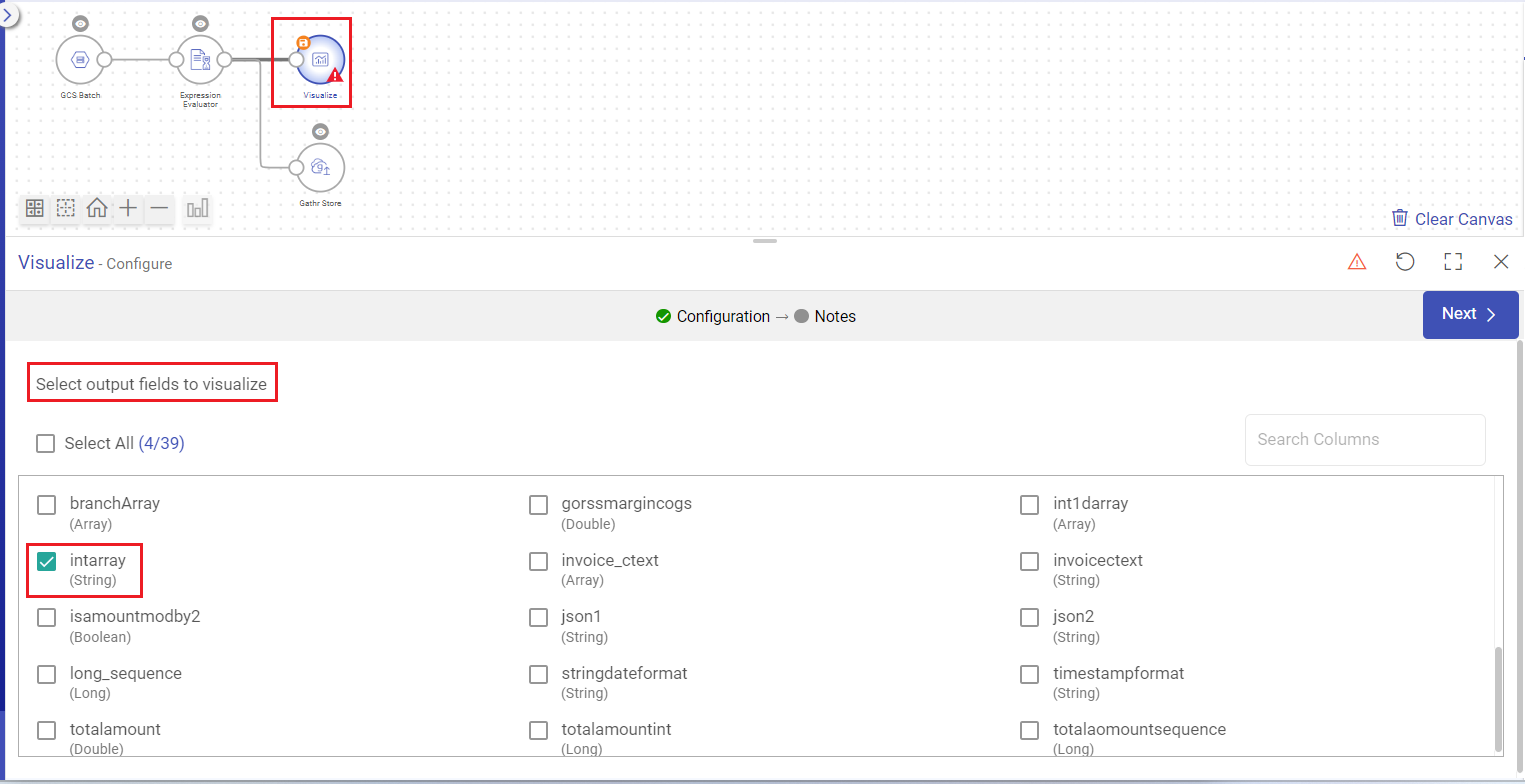
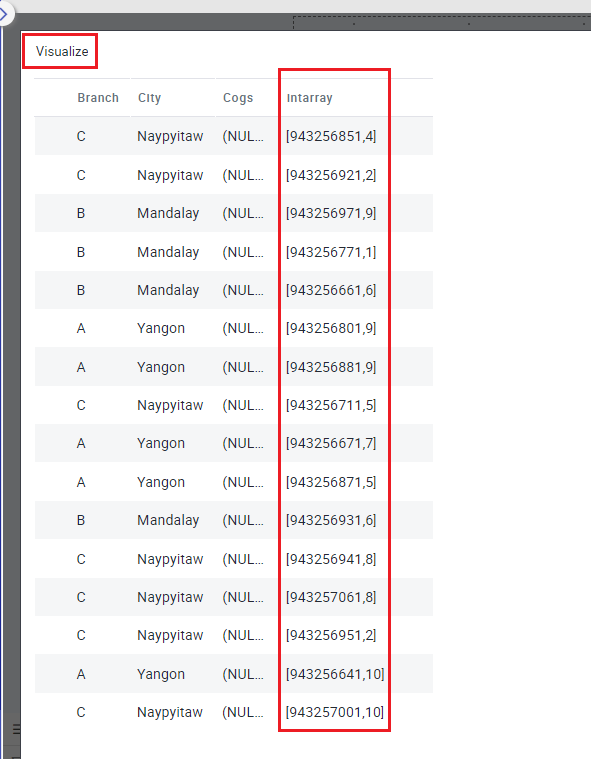
Configure the Visualize component and open the Analytics Designer page to visualize transformed columns.
Date/Timestamp Columns
When visualizing date/timestamp columns, follow these guidelines:
To visualize any date/timestamp column, ensure their data type is “date” or “timestamp” based on the input values and it is not set as “string”.
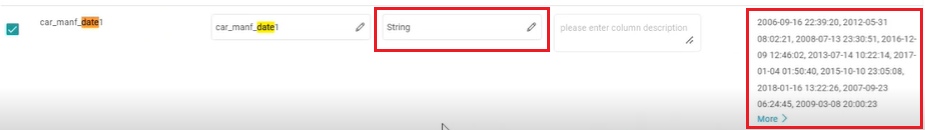
Correctly specify the input format for timestamp data type.
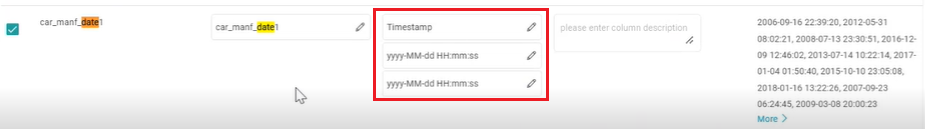
If you intend to process only time for analytics, select the data type as “timestamp,” and provide the input value in a format suitable for your data (e.g., HH:mm:ss).
Visualization Feature FAQs
Q: How long is raw data stored for generating visualizations?
A: Raw data used for generating visualizations is stored for 15 days from the configuration date.Q: Are visualizations supported with streaming ETL applications?
A: No, visualizations are not supported with streaming ETL applications.Q: Can I clone an application that uses the Visualize component?
A: No, you cannot clone an application that uses visualize component.Q: Can I create versions of an application that uses the Visualize component?
A: No, you cannot create versions of an application that uses visualize component.Q: If I create an application using visualize component in a shared project, what actions can other users perform on my application?
A: Yes, other users can view, edit, and execute applications containing Visualize components in a shared project.
Non-project owners can also see ETL applications with Visualize components in shared projects > workflows.
If such an application is locked for editing by a user, then other users will be able to only view the application, without being able to inspect it.
Q: Can users who are not project owners access the Visualize component in shared projects?
A: Yes, users who are not project owners can access the Visualize component in shared projects.Q: Is Visualize supported with BYOC (Compute Setup) options like AWS/Databricks?
A: No, Visualize is supported only on Gathr compute and not with BYOC (Bring Your Own Compute).If you have any feedback on Gathr documentation, please email us!