Data Quality
Actions Available
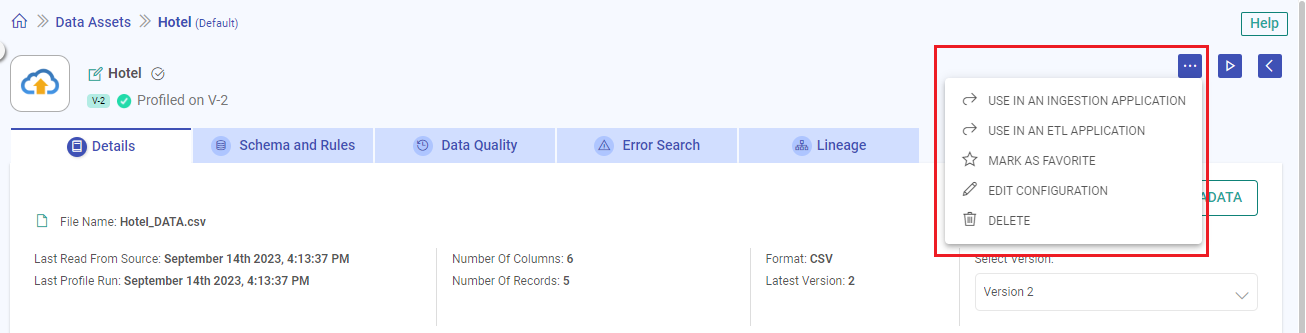
There are various actions that can be performed on each tab of the view data asset, in addition to the listing page.
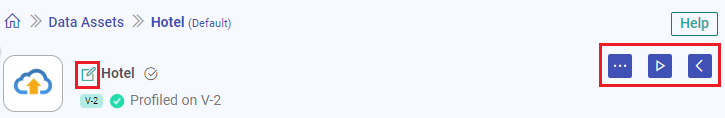
Edit Data Asset Name: Modify the name of the data asset to better suit your needs.
Additional Options: Access a range of actions including deletion, utilization in Ingestion or ETL Applications, marking as a favorite, and configuring the data asset.
Start Profiling: Initiate data profiling to gain insights into your data’s characteristics and quality.
Back to Data Assets Listing: Return to the list of all data assets for an overview of your data
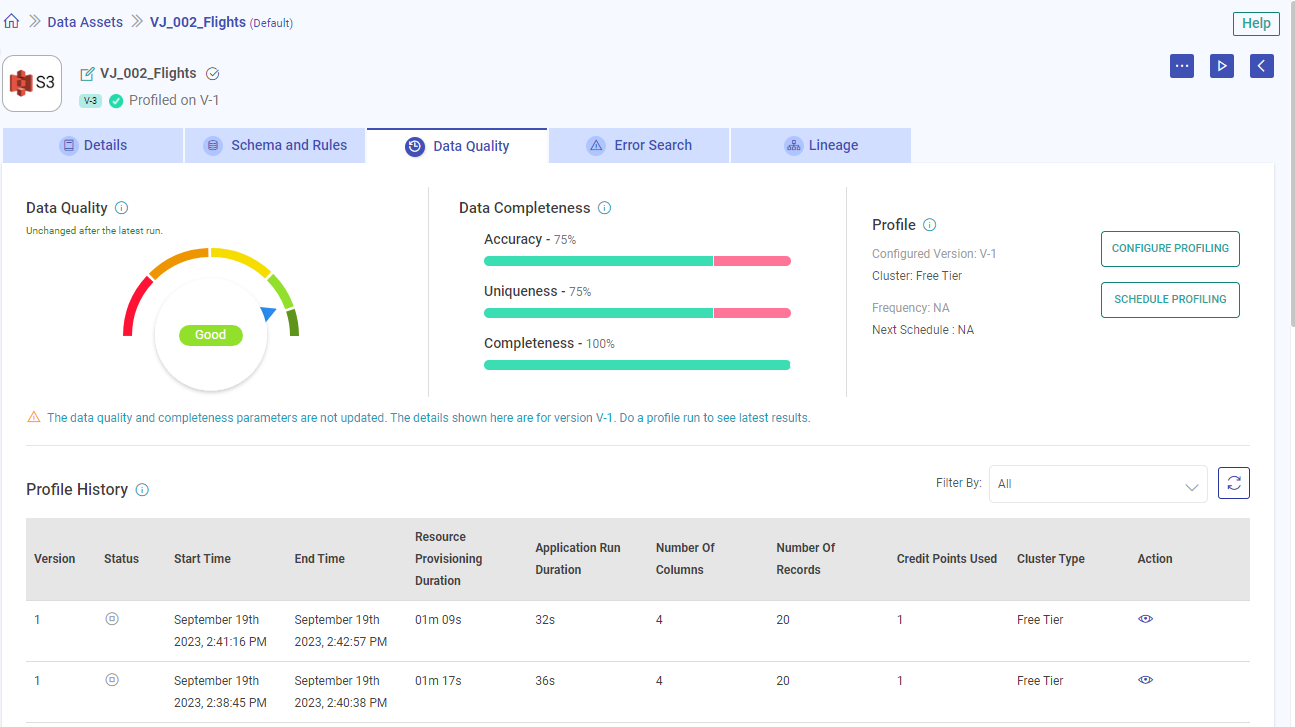
Data Quality
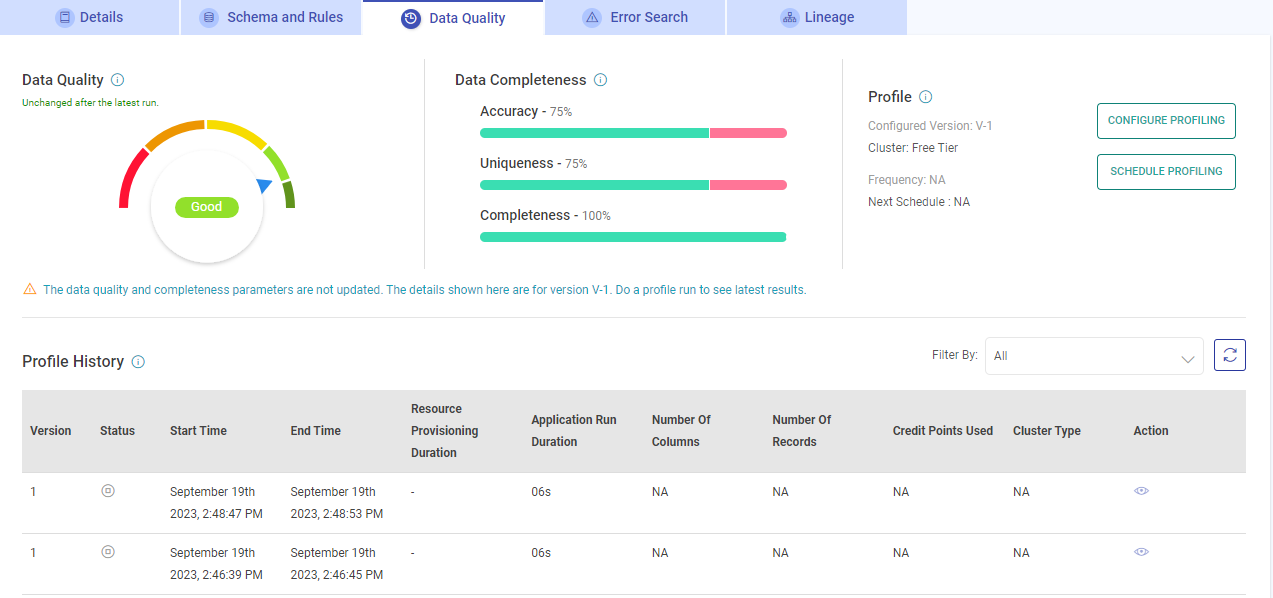
The data quality of the source is measured to assess the accuracy, completeness, consistency, and overall reliability of the data asset.
If the data quality is not available for a data asset, the below message will be shown:
“Data Quality is not available for this Data Asset. Do a profile run (use the play button at the top-right section) to calculate the overall data quality.”
If a new version is created for a data asset, but its profile run is not done, the earlier version’s data quality for which the profile run has been done will get displayed.
In order to get the data quality of the latest version, a profile run should be done.
It is divided into the following sections:
Poor: Falls between 0-25% of the overall data quality score. A poor data asset cannot be trusted due to inaccuracies, inconsistencies, or a lack of credibility.
Average: Falls between 25-50% of the overall data quality score. An average data asset is insufficient in terms of quality, quantity, or relevance and lacks the necessary attributes to support effective analysis.
Fair: Falls between 50-75% of the overall data quality score. A fair data asset meets acceptable standards of accuracy, and is free from major errors and inconsistencies.
Good: Falls between 75-90% of the overall data quality score. A good data asset is accurate, and can be trusted for analysis or decision-making.
Excellent: Falls between 90-100% of the overall data quality score. A data asset that is exceptionally good and of high quality. It signifies data that stands out due to its quality and reliability.
The percentage change in data quality is explicitly shown after the latest profiling of data assets. It can go down, up, or remain unchanged from the last percentage.
Data Completeness
A comprehensive source data analysis is conducted to ensure a reliable single source of truth.
If the data completeness is not available for a data asset, the below message will be shown:
“Data Completeness is not available for this Data Asset. Do a profile run (use the play button at the top-right section) to calculate the data completeness.”
If a new version is created for a data asset, but its profile run is not done, the earlier version’s data completeness for which the profile run has been done will get displayed.
In order to get the data completeness of the latest version, a profile run should be done.
Data completeness is expressed as a percentage and measured based on the following factors:
Accuracy: Indicates the proportion of accurate versus inaccurate data (including redundant and null rows).
Uniqueness: Determines how much of the data is unique versus duplicated.
Completeness: Calculates the proportion of complete versus incomplete data (including null rows and empty strings).
Profile
The profile section displays the assigned cluster and data asset scheduling details.
Configure Profiling
Option to select the data asset version on which the profiling should run and configure deployment settings on either Gathr cluster or EMR cluster. associated with the registered compute environment.
The prerequisite to utilize registered clusters for running data assets is to first register a cloud account from User Settings > Compute Setup tab.
To understand the steps for registering a cloud account, see Compute Setup →
Schedule Profiling
Scheduling profile runs enables you to automate the data asset profiling at a required frequency, reducing the need for manual intervention.
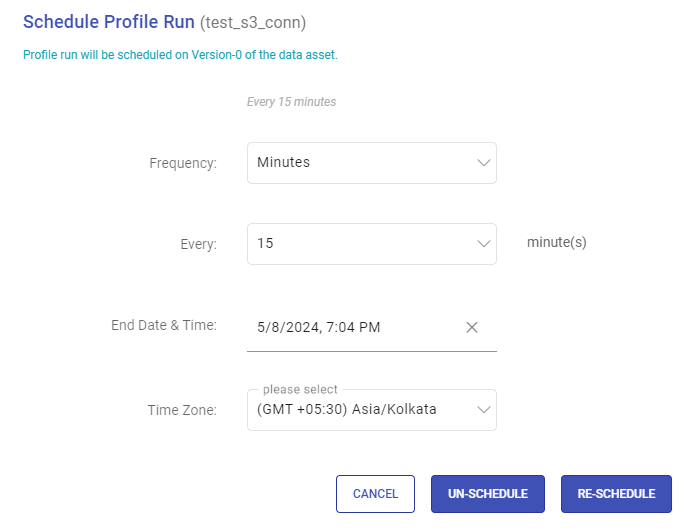
Once you click on Profile Scheduling, you will have the option to schedule a profile run frequency, and once it is scheduled, an UN-SCHEDULE and RESCHEDULE button will be available to manage scheduling needs.
Automate the execution of the application according to your desired timeframes and intervals.
Scheduling Frequency
Configure scheduled profiling of Data Assets based on various frequencies.
Minutes: Specify the interval in minutes at which the profiling should be done. For example, if you set it to 15 minutes, the data asset will be profiled every 15 minutes.
Hourly: Choose an hourly frequency for data asset profiling. You can specify the number of hours between each execution.
Daily: Set up daily profiling of data asset. You can select specific times of the day for execution.
Weekly: Define a weekly schedule for data asset profiling. Choose the days of the week and the time for each day when the application should run.
Monthly: Schedule the profiling to run on specific days of the month. You can choose specific dates or specify criteria like the first Monday of the month.
Yearly: Set up yearly profiling for the data asset. Specify the month, day, and time for execution.
Scheduling End Date & Time
Define when the scheduled executions should stop.
You can specify an end date and time after which the scheduling will no longer occur.
This is useful for scheduling tasks that have a finite duration or are only needed for a certain period.
Time Zone
Specify the time zone in which the scheduling should occur.
This ensures that data asset profiling runs at the desired time in the specified time zone.
Cron Expression
This field shows the set scheduling pattern in a cron syntax.
For example, a cron expression of “0 0 0 1/1 * ? *” would execute the task at midnight every day.
Un-Schedule Data Asset Profiling
Un-Schedule profiling refers to the action of removing the scheduling configuration of a data asset.
When you un-schedule, it means that the data asset will no longer run profiling automatically according to the previously defined schedule.
Essentially, it cancels the automated scheduling, allowing you to manually trigger its execution as needed.
Re-Schedule Data Asset Profiling
Re-Schedule allows you to adjust or update the scheduling configuration of a data asset.
This could involve changing the frequency, timing, or other parameters of the scheduled execution.
When you re-schedule profile, you are essentially modifying the data asset’s scheduling settings to better suit your current requirements or preferences.
This ensures that data asset profiling continues to run automatically according to the updated schedule.
Profile History
A tabular form of profile history is shown with details of the Data Asset profile:
| Field Name | Description |
|---|---|
| Version | Version number of the data asset. |
| Status | The current state of the data asset. |
| Start Time | The timestamp record when the data asset profile run was started. |
| End Time | The timestamp record when the data asset profile run stopped. |
| Number of Columns | Number of columns in the data asset. |
| Number of Records | Number of records in the data asset. |
| Last Profile Run | The date and time when the last profile run got completed successfully. |
| Credit Points Used | Total credit points consumed for the data asset profiling. |
| Cluster Type | The cluster details assigned to the data asset for profile run. |
| Action | Option to view the data asset’s profiling results. |
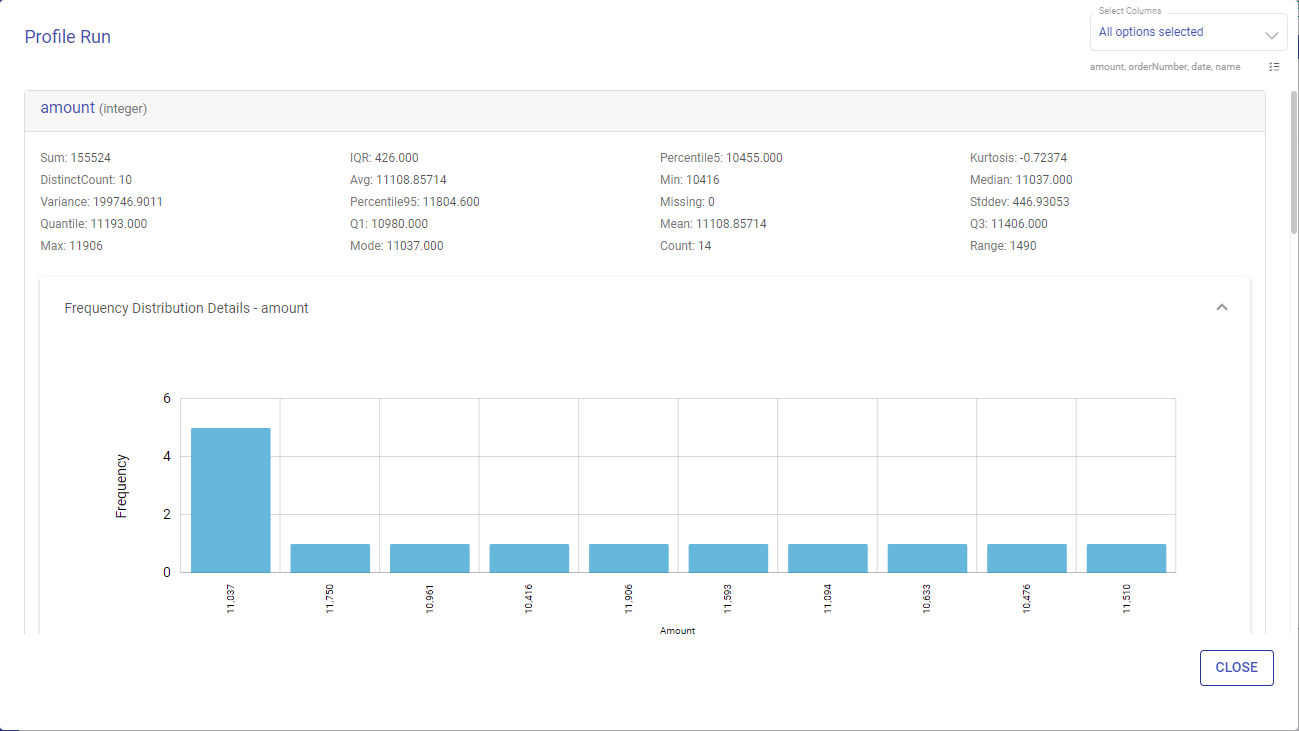
View Run Profile
The Profile Run window shows various statistical insights on each variable like Avg, Min, Max, Percentile etc.
You can also click on the Frequency Distribution Details Label to see the frequency distribution corresponding to every variable.
Frequency Distribution Details:
Frequency distribution of any attribute/field is the count of individual values for that field in whole data asset.
For Numeric type fields, it is shown in terms of counts only.
For String/Date/Timestamp, you can view the frequency/counts along with its percentage.
The Frequency Distribution Graph is generated for every variable in the data asset.
You can filter or sort variables for which you need to see the data profile.
If you have any feedback on Gathr documentation, please email us!