Data Assets Error Search
To view the Error Search tab for a data asset, click on VIEW from its listing page and switch to the Error Search tab.
Actions Available
There are various actions that can be performed on each tab of the view data asset, in addition to the listing page.
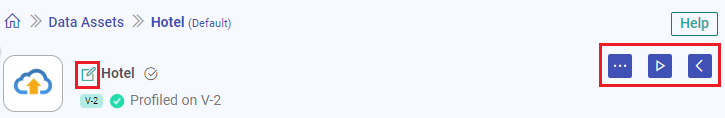
Edit Data Asset Name: Modify the name of the data asset to better suit your needs.
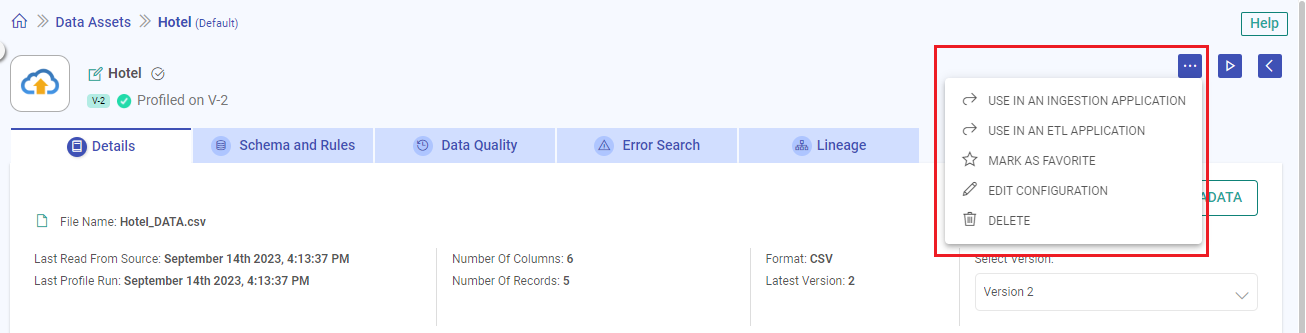
Additional Options: Access a range of actions including deletion, utilization in Ingestion or ETL Applications, marking as a favorite, and configuring the data asset.
Start Profiling: Initiate data profiling to gain insights into your data’s characteristics and quality.
Back to Data Assets Listing: Return to the list of all data assets for an overview of your data
Overview
You can find a range of information on the Error Search tab for a data asset application.
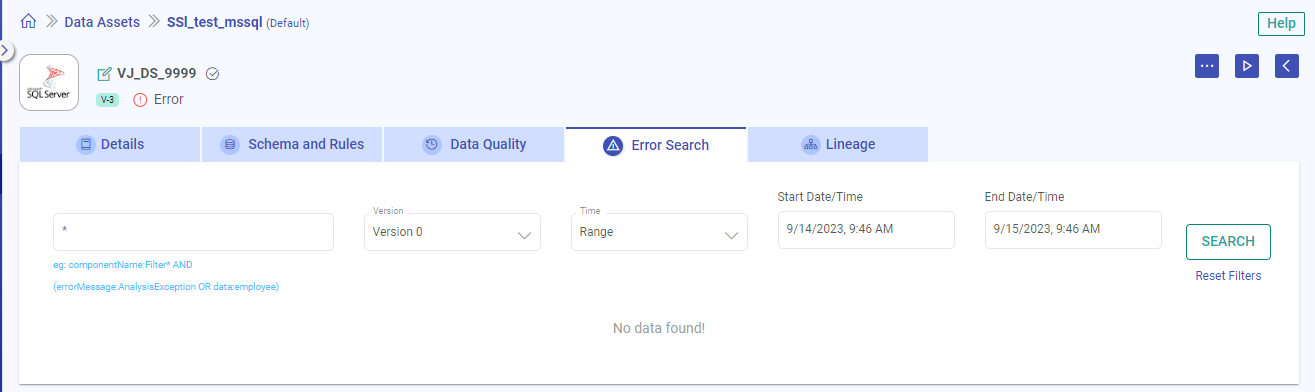
The error search feature can identify erroneous data, pinpoint causes of data asset profiling failure.
Additionally, it provides a full stack trace corresponding to any errors detected. Using the error search tab, you can easily see a distribution of errors over time for a data asset.
This feature also allows you to pan and zoom into a specific time range or duration and display results as a histogram distribution.
Full Text Search
The search bar allows the user to do a full text search on certain keywords.
Example: A search for errors associated with data “rubel,25,75000”.
Then a full text search by entering keyword rube’ can be done and it will give you all the errors that have keywords starting with rube.
Keyword Search
Also, you can do keyword search on following pre-defined fields:
componentName
data
errorMessage
Example: errorMessage:de-serialize AND data:rube*
This will give all the errors occurred, where the error contains keyword de-serialize and data containing words starting with rube.
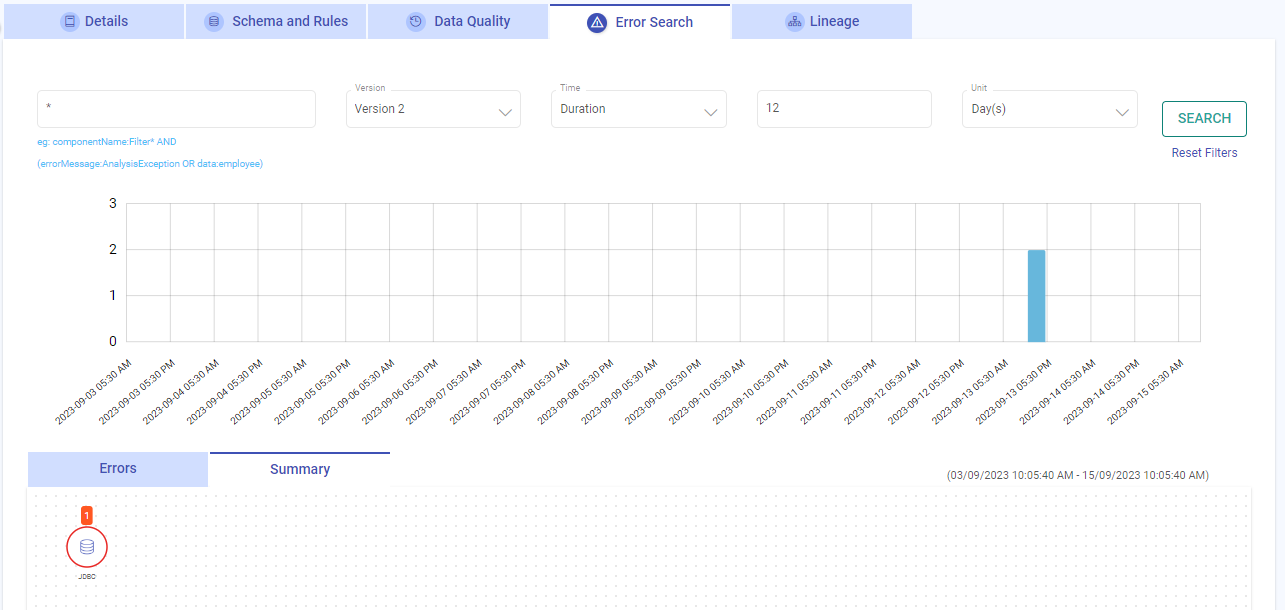
Visualizing Search Results
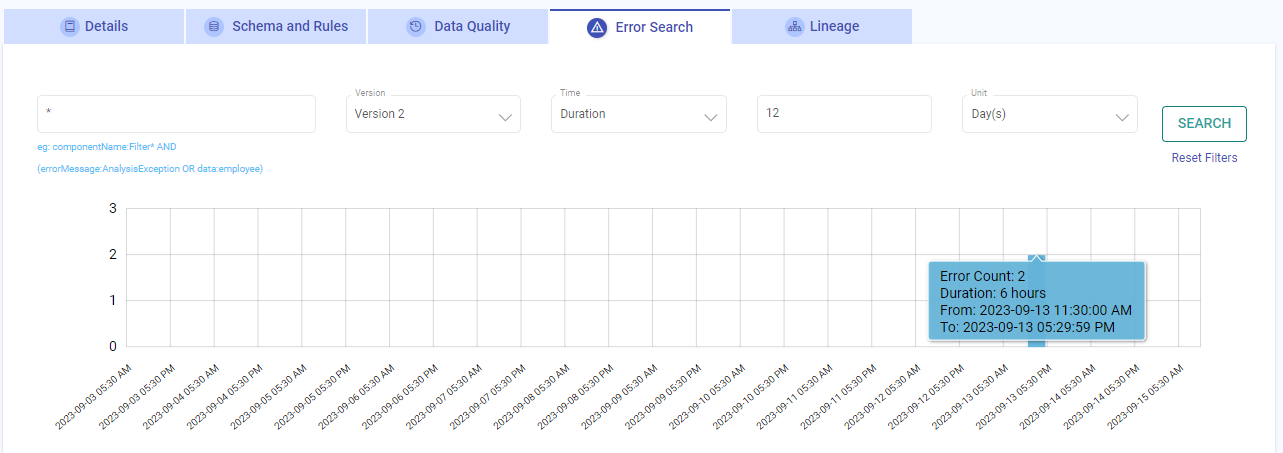
The search bar allows you to search for errors in the data asset within a time range or by duration. The below graphs shows the visualization of search results on the graph itself.
Time-Series Count of Events
The search bar allows you to search for errors in the data asset in a time-series pattern with count of the events. The generated graphs shows the visualization of search results on the graph itself.
Graph Panning and Zooming
Zoom in the graph, by selecting a particular region. New search request will be placed with drilled-down time range boundaries.
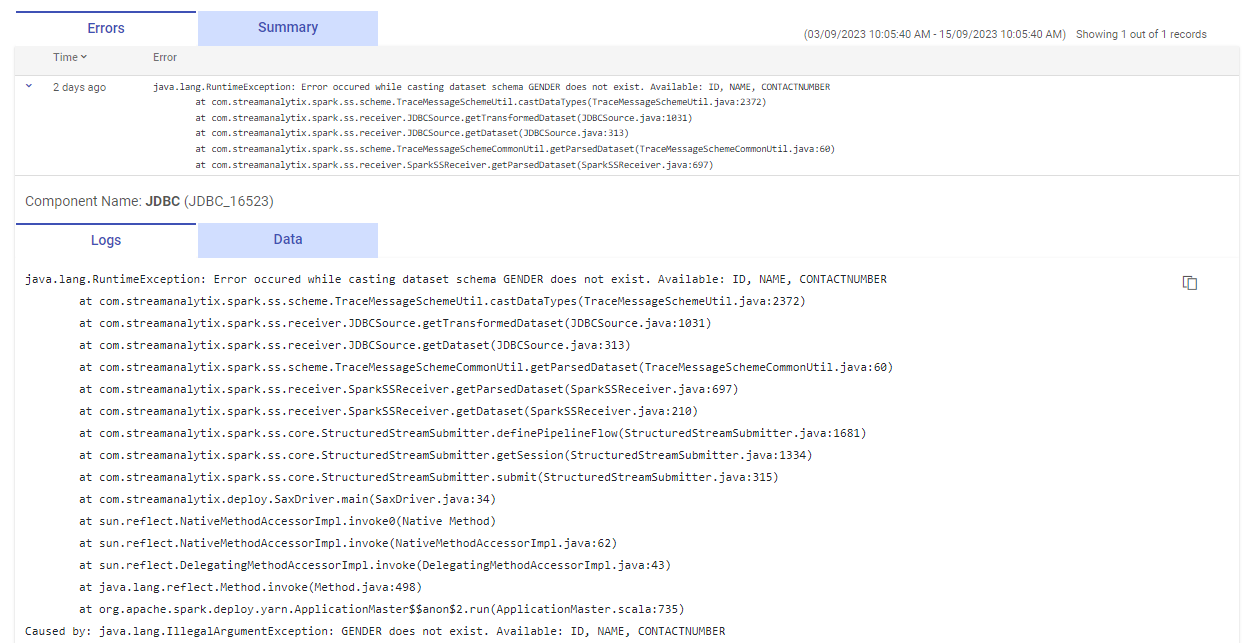
Errors
The Errors tab records the time when an error occurred, as well as the corresponding error message, logs, and data.
Logs and Data
To review error logs and data, expand the desired entry. You can copy the logs and data for future reference and debugging purposes.
Error Summary
Under the Summary tab, you can see the erroneous connector and the number of errors on each connector in the data asset.
If you have any feedback on Gathr documentation, please email us!