Monitor ETL Application
This feature enables you to monitor error metrics of a pipeline and the error search tab allows you to search errors using keywords and filters.
Monitor tab has Error Metrics graph which shows a representation of average error rate (mean, 1 min, 5 mins and 15 mins) occurring within the pipeline corresponding to an executor instance.
Query Monitor
Query monitoring shows graphical representation of metrics related to structured streaming query per emitter.
There are three types of graphs that are shown under Monitor, as explained below:
Input vs. Processing Rate
This shows a comparison of how the pipeline is performing with respect to the input rate of data and the actual processing rate of the pipeline.
The input rate specifies rate at which data is arriving from a source (Data Source) e.g. Kafka. Processing rate specifies the rate at which data from this source is being processed by Spark.
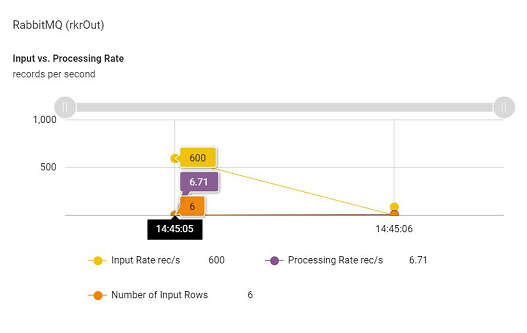
Here, number of input rows defines number of records processed in a trigger execution.
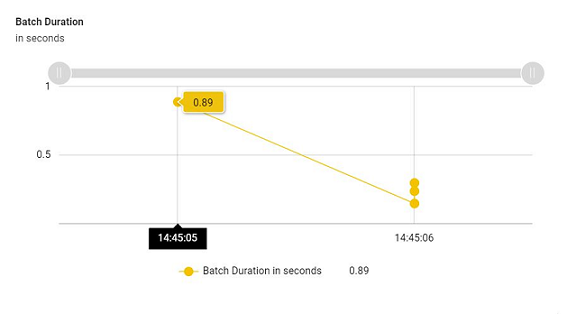
Batch Duration
Approximate time in to process this over all micro-batch (trigger) in seconds.
This shows a time series representation of how the micro batches of the pipelines are performing with respect to time.
It helps in identifying if there has been any bottleneck in the processing of a micro batch in the past.
Aggregation State (optional)
Shows aggregation state of current streaming query, if the pipeline has an aggregation processor.
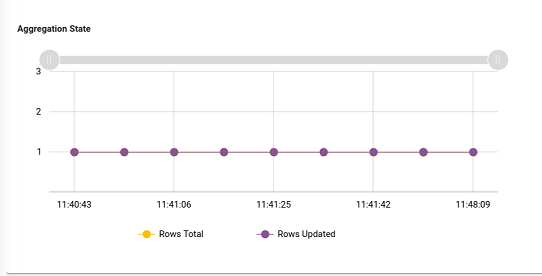
It shows information about the operator query that stores the aggregation state.
If you have any feedback on Gathr documentation, please email us!