Update Pipeline Configuration
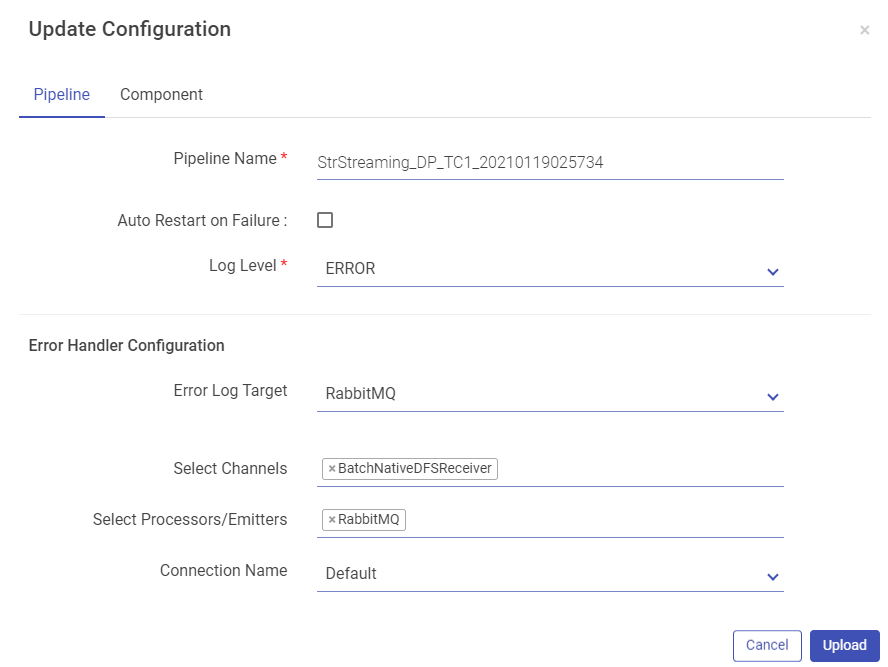
The next window has two tabs, Pipeline and Component.
Pipeline button has properties such as, Pipeline Name, Log Level, Yarn Queue, and HDFS User. Expand the pipeline configurations by clicking on More button (which appears on the next screen). More button allows you to configure Error Handler Configuration for the modified pipeline.
Click on the Component tab to update pipeline component configuration and connection details if required. Once done, click on the Upload button to upload the pipeline with the changes configured.
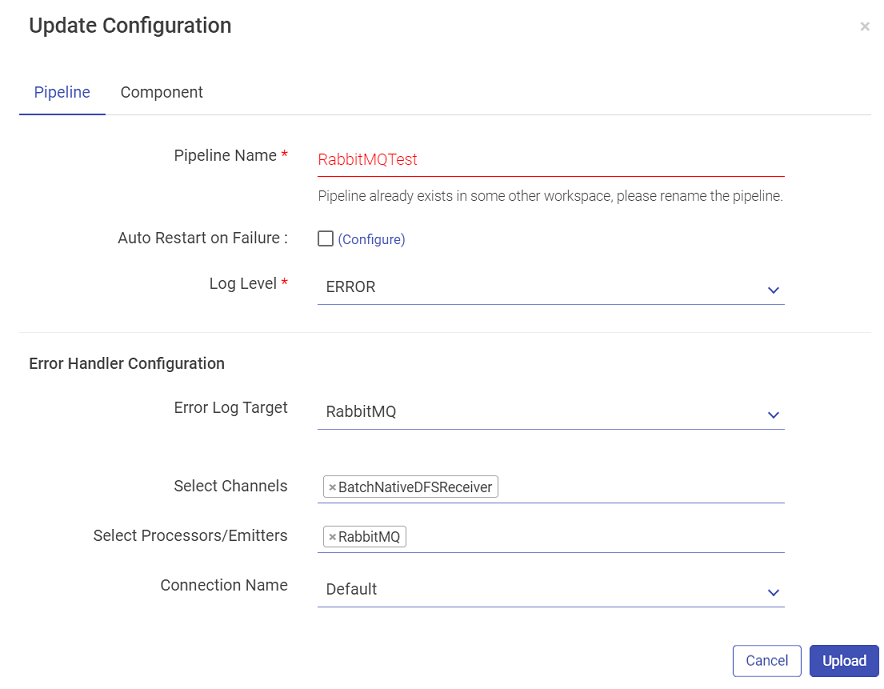
While uploading the pipeline, if the components used in the pipeline are not configured in the Workspace it is uploaded, then no connection will be available for that particular component.
This will not abort the upload process but the Start button of the pipeline tile will remain disabled until a connection is configured for the respective component.
Once a connection is created, update the pipeline and select a corresponding connection to play the pipeline.
New Pipeline button will allow to save the uploaded pipeline as a new pipeline.
First page will be the exported pipeline’s details page and after clicking on Proceed button, Pipeline configurations are displayed where the pipeline’s name and other configurations can be changed.
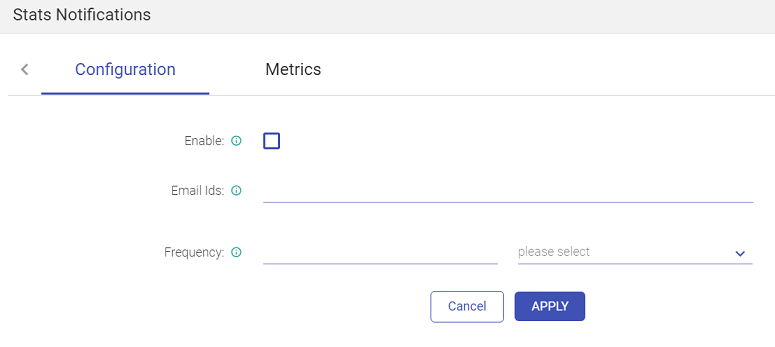
Stats Notification
This tab enables sending emails with the statistics of the data pipeline, to a user with customized details.
Click on Stats Notification from the pipeline tile of the Data Pipeline homepage.
This page allows you to enter the email address, on which you will receive the emails. Choose the duration of the emails, as show below:
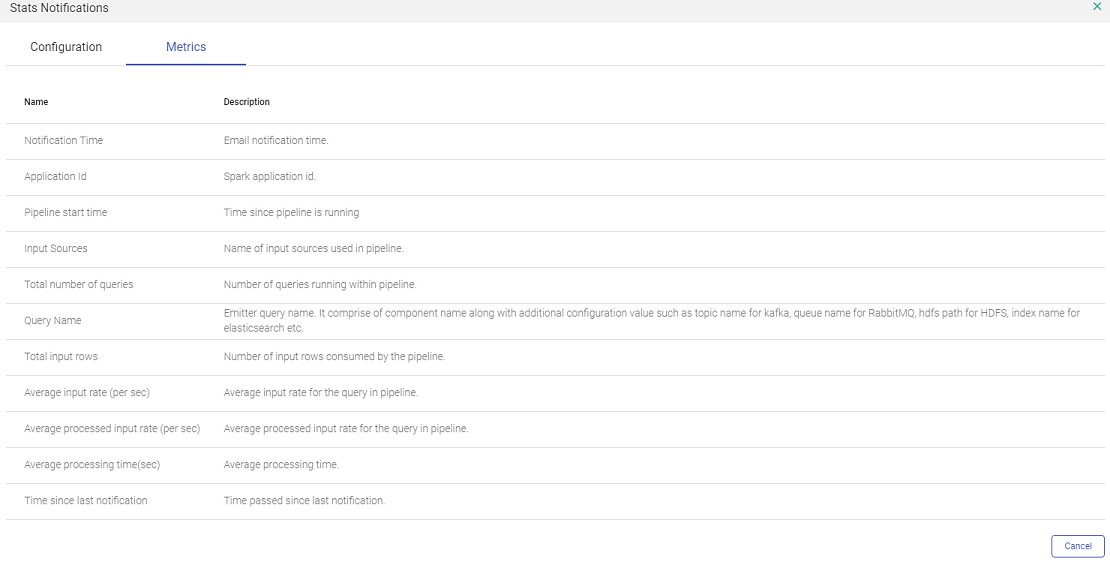
The other tab Metrics shows all the metrics of the pipeline that will be sent in the email.
View Summary
Once a pipeline has been started and is in Active Mode, you can view its Summary.
To view the real-time monitoring graphs, click on the pipeline summary (go to the Data Pipeline page > Pipeline tile > click on the View Summary icon) as shown below:
To enable real time monitoring graphs, go to
Configuration >defaults >spark > EnableMonitoringGraphs and set its value to true
By default, this value is set to False.
In addition, you can view the Spark Job page from the application_1525…. link as shown below:
The View Summary tab provides the following Tabs:
Monitoring
Under the Monitoring Tab, you will find the following graphs, as shown below:
Query Monitor
Error Monitor
Application Error
Query Monitor
The graph will be plotted in panels, these panels will be equal to the number of emitters used in the structure streaming pipeline. Each panel will have three graphs as per below discretion. These graphs can be seen through the view summary option.
Input vs. Processing Rate
The input rate specifies rate at which data is arriving from a source (Data Source) e.g. Kafka.
Processing rate specify the rate at which data from this source is being processed by Spark
Here number of input rows defines number of records processed in a trigger execution.
Batch Duration
Approximate time in to process this over all micro-batch(trigger) in seconds.
Aggregation State
Shows aggregation state of current streaming query. It shows information about operator query that store the aggregation state. The graph will be seen in case if pipeline has done some aggregation.
If you have any feedback on Gathr documentation, please email us!