Visualizing Audit Results
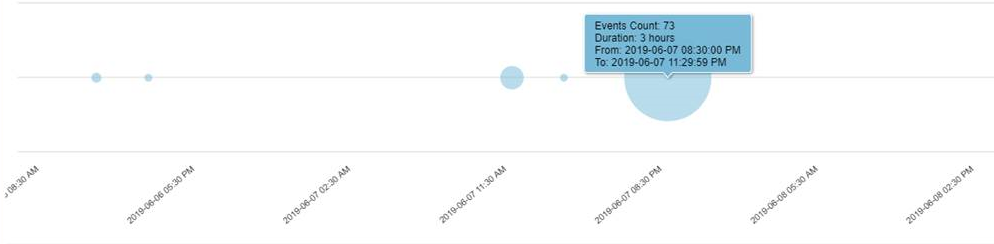
Time-Series Count of Events
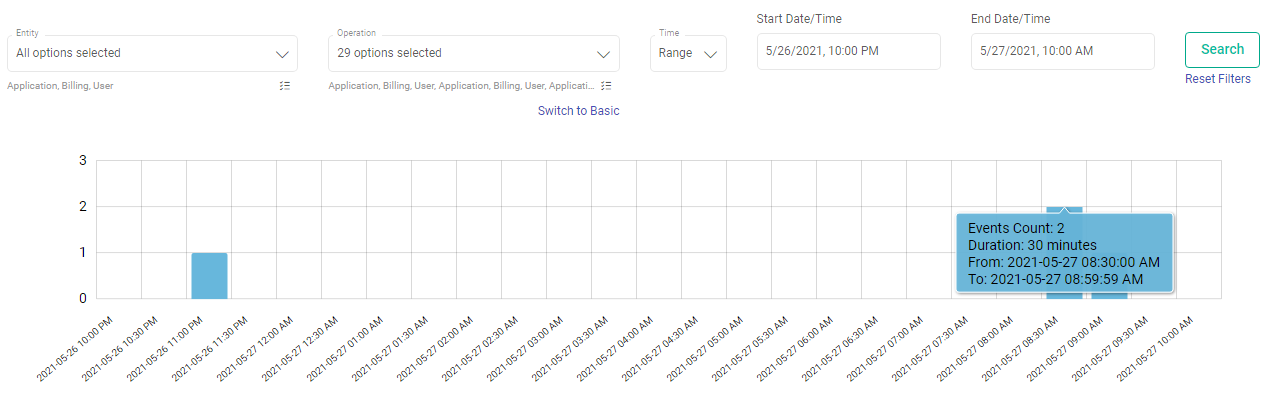
Time-series graph represents aggregated count of events occurred within given time range. The counts will be shown on time series graph with fixed time intervals. Each interval is represented by graph bar.
Time intervals are calculated based on given time range values in search query. Bigger the given time range, bigger will be the time interval.
Example: 12 hours as input time range will give event counts of every 30 minutes interval 1 hour as input time range will give event counts of every 1 minute interval.
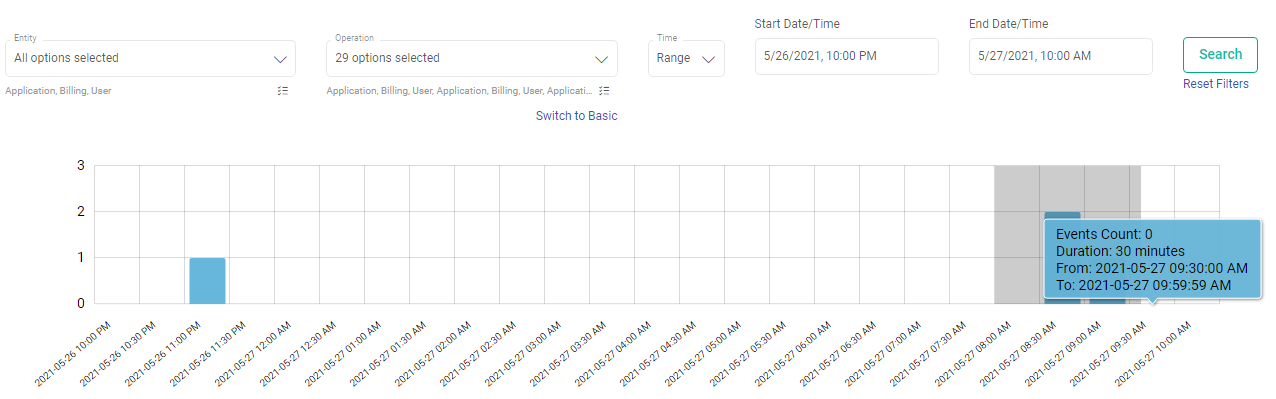
Graph Panning
It allows you to zoom in on a specific area of the graph, which will drill down the graph further and will show the zoomed selected area. New search request will be placed with zoomed time range boundaries.
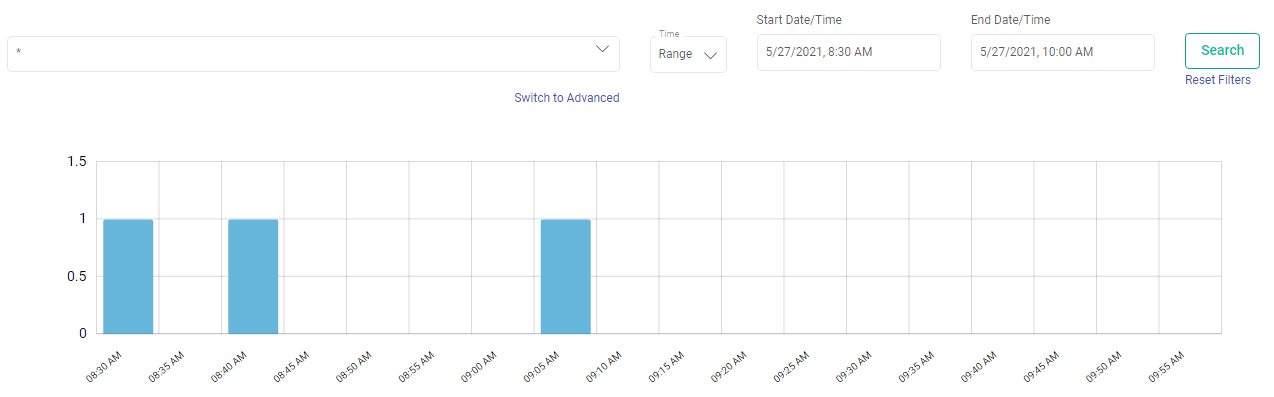
After panning and zooming the results, the graph looks as shown below:
Processing Search Results
Perform following operations on the search results:
Infinite Scroll
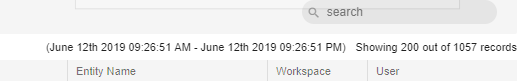
Whenever you scroll down in Result table, next bunch of 100 records will be fetched and appended in result table. You can change the default 100 fetch-size from Audit Configuration page.
Scroll has defined an expiry time after which scroll window will be expired. Default scroll expiry time is 5 minutes.
On every subsequent scroll and new search request, scroll expiry time will get reset.
Sorting of Events
You can sort results based on field value of events. A new search request will be placed on each sort action and top 100 (default fetch size) sorted results will be shown out of total matched hits.
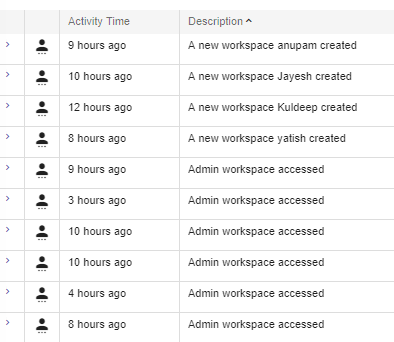
Pipeline Audit Trail
This functionality shows the event activities performed on a pipeline.
Event counts are represented by circles on time series graph.
Event interaction will be auto deleted after configured retention time.
If you have any feedback on Gathr documentation, please email us!