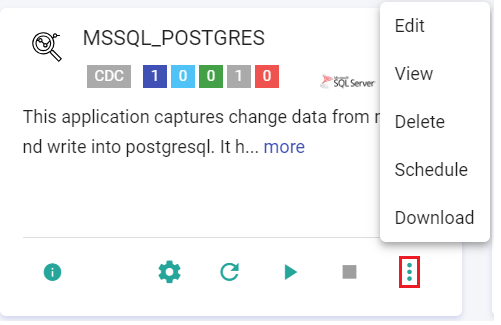
Actions on CDC Applications
Once you have created the application, you can view it on the Applications dashboard.
You may start or stop the CDC application by clicking on the Start or Stop button.
As you click the ellipsis on the right-bottom corner of the tile you will be able to Edit, Delete, Schedule and View the application.
Configure Job
This option is available on-cloud. Click the gear icon to Configure Job. A window appears to configure the job of the particular pipeline. Click Gear icon under Action Column to proceed further. User also has an option to Replicate Configuration is available under Action Column.
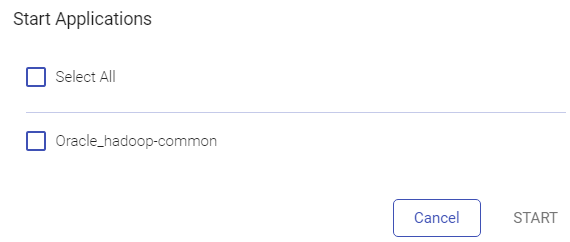
Start
Once you click on Start button, you get an option to choose the pipeline created within the application and start them. You will see only the stopped pipeline(s) here before you start the operation.
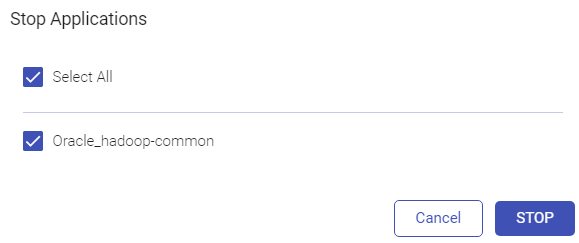
Stop
Likewise, you may stop the running application by clicking on the Stop button or choose a specific pipeline to stop running it. You will only see the started pipeline here to perform the stop operation.
Edit
Once you click on the Edit button, you will be able to make edits in the application. You will be transported to the Source panel from where you can start making the required changes in the existing CDC application from the beginning.
Delete
If you need to Delete the application, click on the ellipsis on the left side of the CDC application tile. Click Delete to delete the existing CDC application.
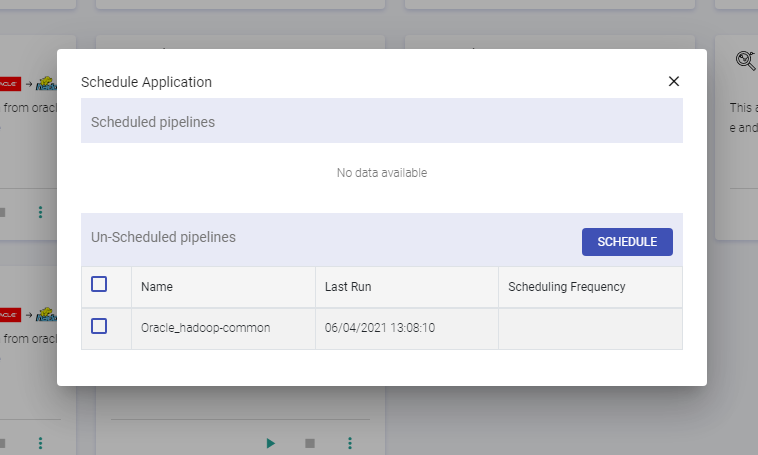
Schedule
In the schedule application window you can view the scheduled and unscheduled pipelines. To schedule a pipeline, select one and click the Schedule button. Similarly, you can un-schedule and re-schedule the pipelines.
Download
From the ellipses of the application tile, you have an option to download the application. Likewise, on the application listing page, you have an option to upload the application. The Upload Application button is available right next to + icon New Application button.
View
As you click on the View button to navigate across the application dashboard, you can view three default widgets available on application monitoring dashboard. The Error Search button will be available on when JDBC Emitters are selected for creating CDC app. This option will not be visible for GCP, Snowflake, Teradata, ADLS, S3, Hadoop, Hive, DeltaSQL emitters.
Default Widgets
Once you open the application dashboard, you see three default widgets on dashboard page:
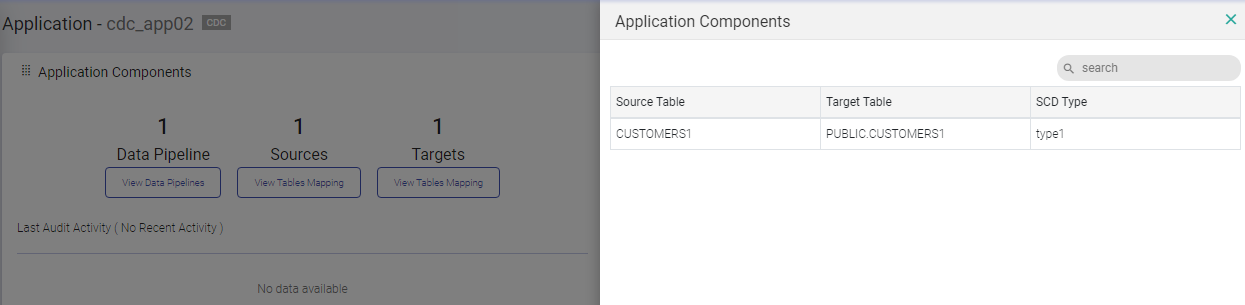
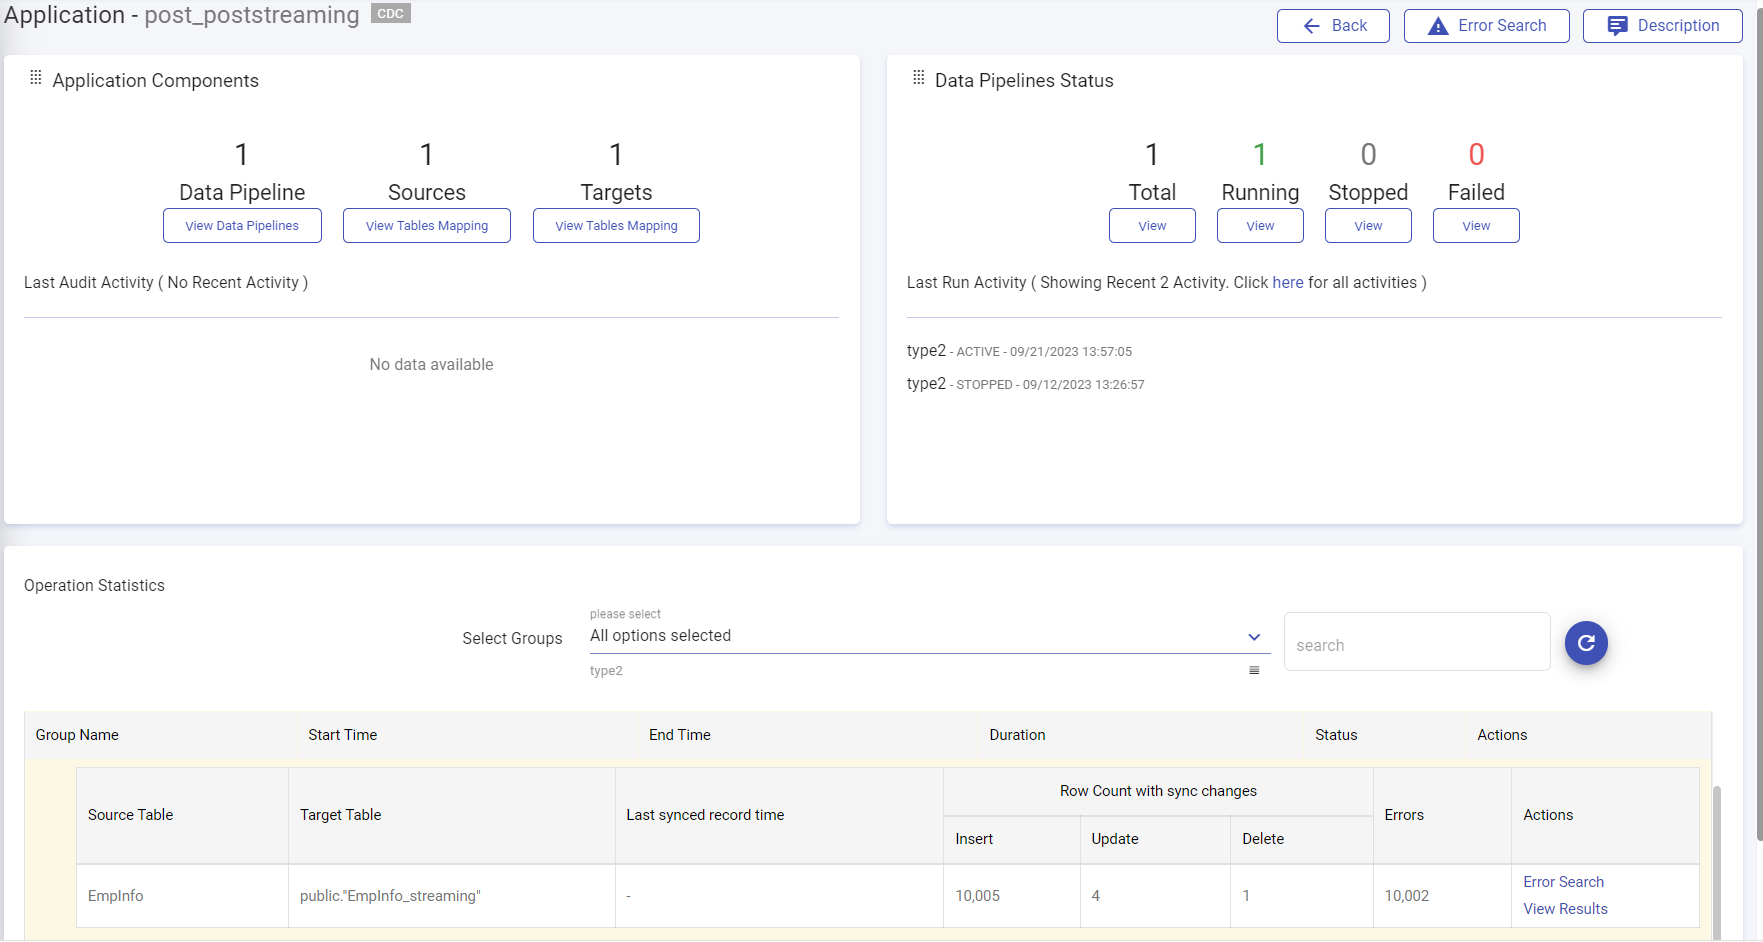
Application Components Widget
In the Application components widget, you can view the components including Data Pipelines, Source Tables, Target Tables and the Audit activity.
Data Pipelines
As you click the View Data Pipelines button, you will be able to see all Data Pipelines created by the application.
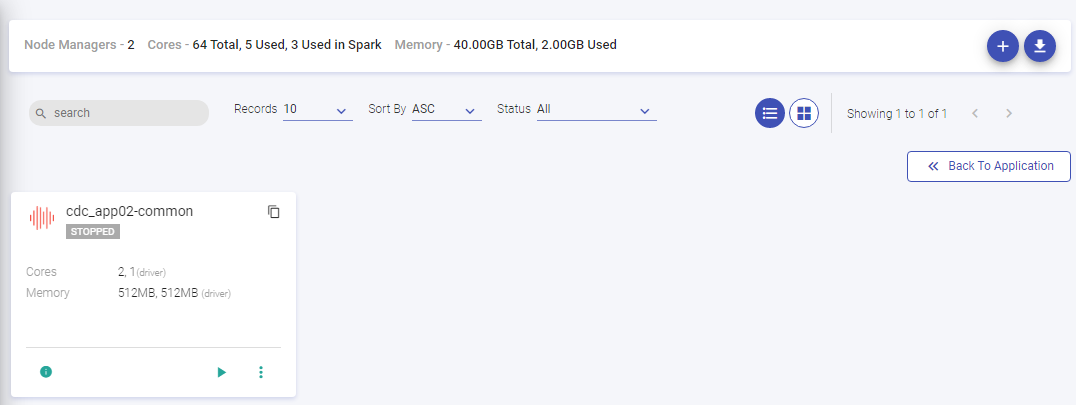
Here, you can Monitor your CDC application, view audit activity, explore history, do scheduling, download version, submit pipeline logs and edit.
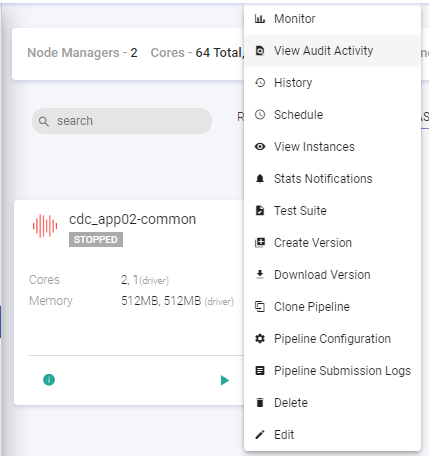
Monitor
Upon clicking monitor, you will be able to view the error metrics of a pipeline, search the Host, select the time unit and refresh intervals of the application. The error search tab lets you search errors using keywords and filters.
View Audit Activity
Upon clicking the View Audit Activity, a window displays the audit activities performed on the pipeline.
History
This feature lets you view the History of the pipeline, that is pipeline details including the start time, end time, status and the application id.
Stats Notification
This tab enables you to send emails with the statistics of the data pipeline, to a user along with the customized details. You can access stats notification via. under Project.
This page allows you to enter the email address, on which you will receive the emails. Here, choose the duration of the emails.
Next to Configuration is Metrics. It shows all the metrics of the pipeline that will be sent in the email.
Download Version
You can also download a version of the pipeline.
Pipeline Submission Logs
Logs of the data pipeline can be viewed by either clicking on Application ID or the Pipeline Submission Logs.
For more details about each section you can refer the Pipeline Submission Logs → section.
View Source Tables
Within the application components you can view the source tables. You can also search a specific source in the search bar.
View Target Tables
The user can view target tables enlisted or search a particular target table in the search bar.
View Audit
The Audit captures and presents all important activities and events in the platform for auditing.
Interaction events include pipeline creation, pipeline inspection, application creation, application edit, license uploads, test-cases execution, configuration updates, connection updates, notebook creation, model validation and all other interactions possible within Gathr. The “View Audit” button available within Application dashboard shows the audit events performed on that particular application.
Data Pipelines Status Widget
In the Data Pipelines Status widget you can click and view the total data pipelines, running pipelines, stopped and failed pipelines. You can also view the run history.
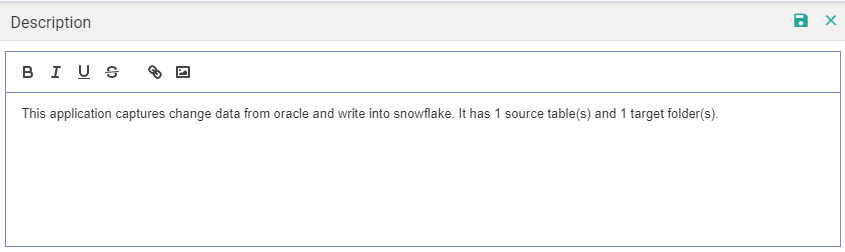
Description Widget
The user can write the logical description about the CDC application and save it. User can also upload an image in description. The description which user provides gets visible on Applications page within tile.
Custom Widgets
Four types of customized widgets can also be added in application. These are explained below:
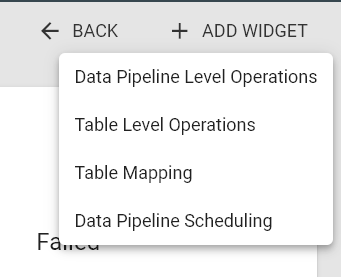
You can add the widget by clicking on the + ADD WIDGET icon.
Data Pipeline Level Operations Widget
In this widget you can view the various operations (insert, update and delete) that were performed across the application at data pipeline level.
In order to create widget, you have to follow the below mentioned steps:
| Field | Description |
|---|---|
| Title | You will have to mention a title for the widget. |
| Data Pipeline | You will have to choose all or the individual data pipeline from drop-down for the widget creation. |
| Operation | You can choose one of the four options: All: You can choose the All option when you want to see the stats for all of the operations. Insert: You can choose the Insert option when you want to see the stats for insert operation. Update: You can choose the Update option when you want to see the stats for insert operation. Delete: You can choose the Delete option when you want to see the stats for insert operation. |
| Execution | You can choose one of the two options: All: You can choose the All option when you want to have stats for all execution. Last Run: You can choose the Last Run option when you want to have stats for last run only. |
| Graph | You can choose one of the two options: Pie: This graph option will be available only when you have selected Last Run in execution option. Column: This Graph option will be used for all other cases when you haven’t chosen the Last Run option in the execution input. |
| Refresh Interval | You can configure the refresh interval of widget from this configuration. Widgets will get auto-refreshed after each configured interval. |
Table Level Operations Widget
You can view the insert, update and delete operations performed at the run time of application.
In order to create widget, you have to follow the below mentioned steps:
| Field | Description |
|---|---|
| Title | You will have to mention a title for the widget. |
| Target | You will have to choose all or the individual source to target table mapping from drop-down for the widget creation. |
| Operation | You can choose one of the four options: All: You can choose the All option when you want to see the stats for all of the operations. Insert: You can choose the Insert option when you want to see the stats for insert operation. Update: You can choose the Update option when you want to see the stats for insert operation. Delete: You can choose the Delete option when you want to see the stats for insert operation. |
| Execution | You can choose one of the two options: All: You can choose the All option when you want to have stats for all execution. Last Run: You can choose the Last Run option when you want to have stats for last run only. |
| Graph | You can choose one of the two options: Pie: This graph option will be available only when you have selected Last Run in execution option. Column: This Graph option will be used for all other cases when you haven’t chosen the Last Run option in the execution input. |
| Refresh Interval | You can configure the refresh interval of widget from this configuration. Widgets will get auto-refreshed after each configured interval. |
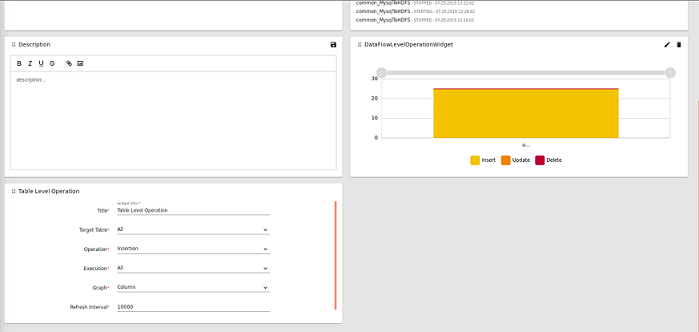
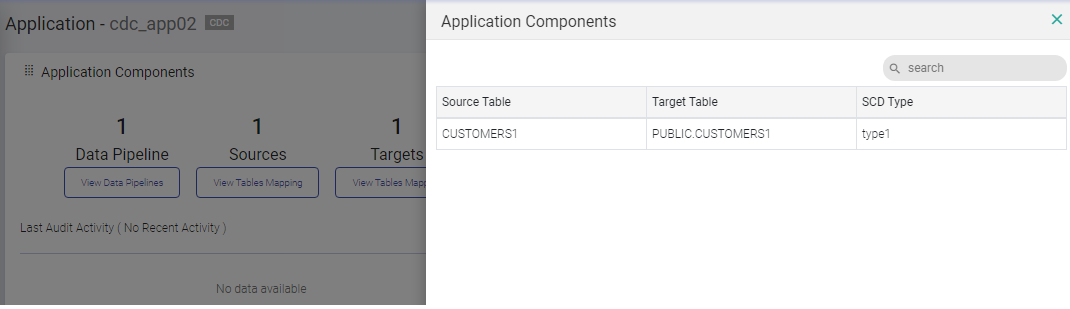
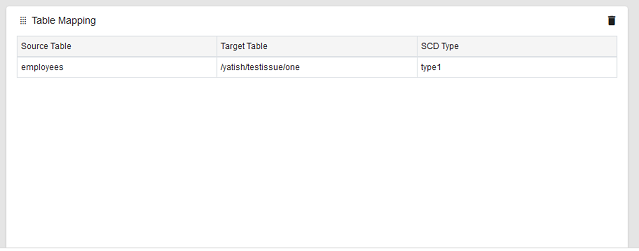
Table Mapping Widget
In this widget, you can view the details of the source table which is mapped to the target table along with the configured SCD type.
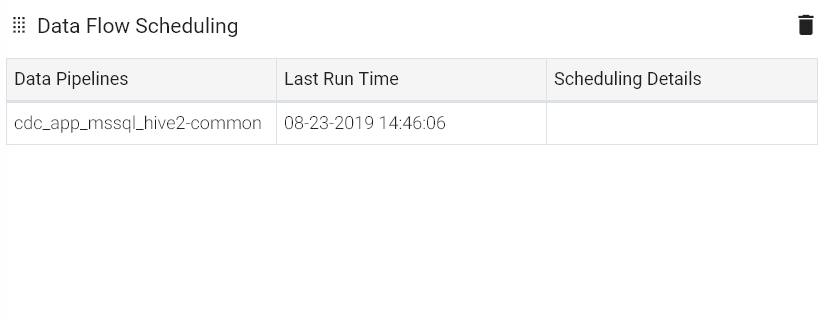
Data Flow Scheduling
Add this widget by Add Widget button. In this widget you can view all the pipeline that are scheduled and at what frequency.
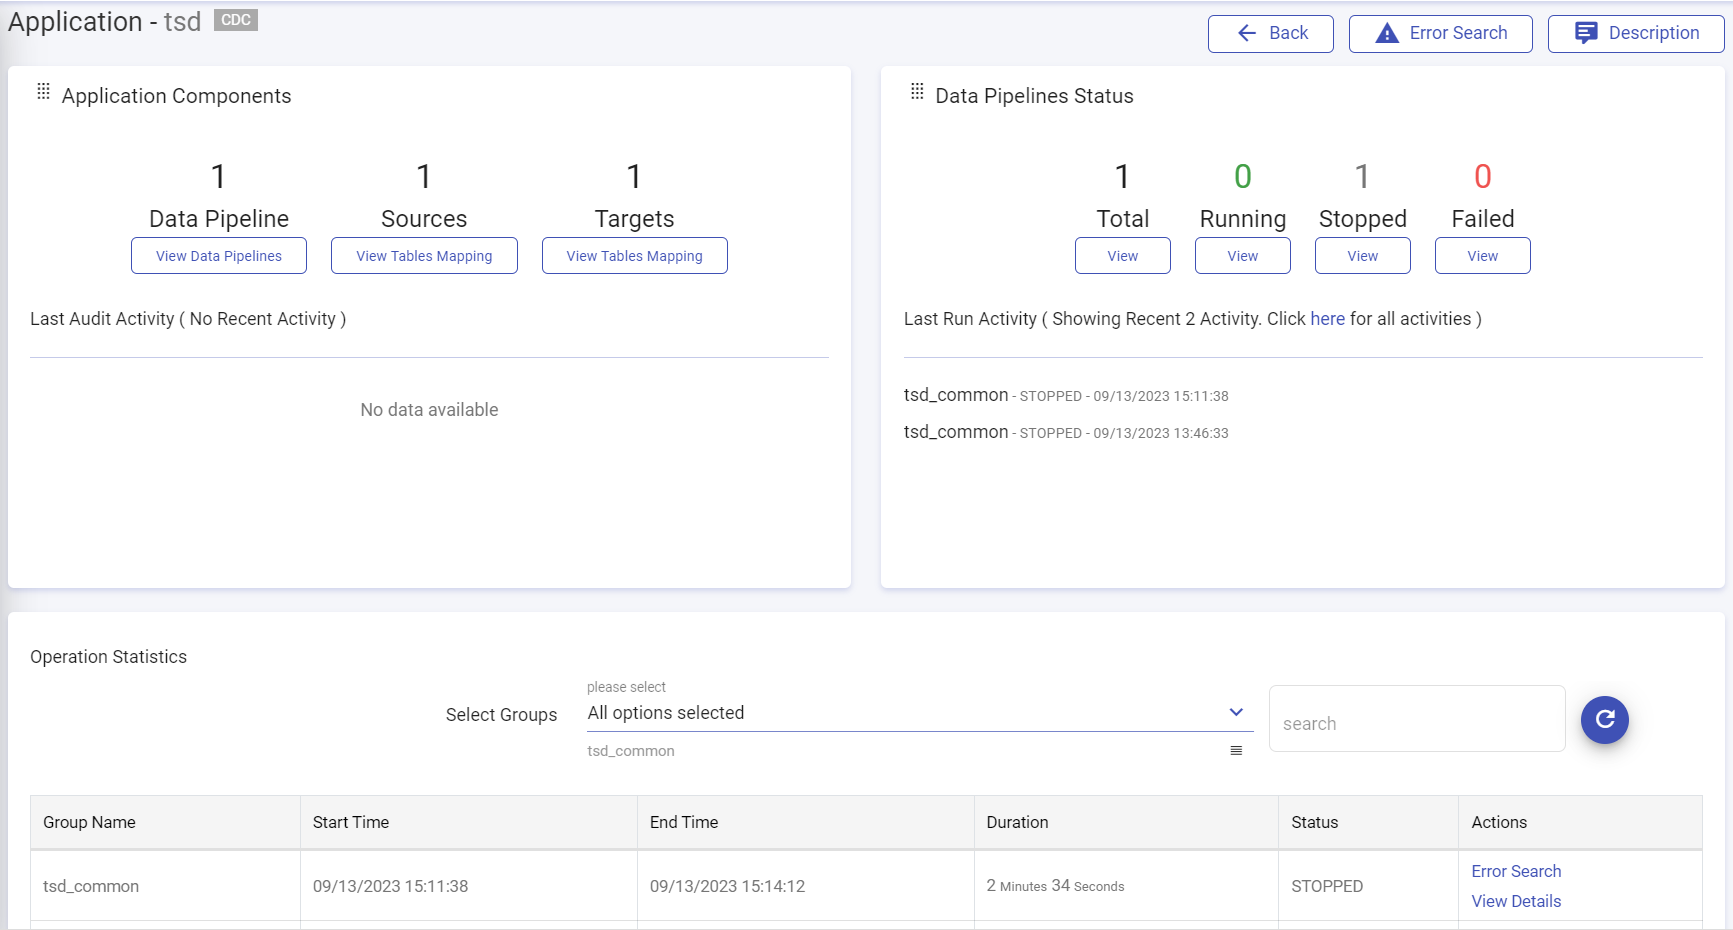
To view details of a CDC application, click on VIEW from its listing page. You can find a range of information on the VIEW details page for a CDC application.
If you select the MYSQL, PostgreSQL, MsSQL, Mem SQL or Oracle (Emitter/JDBC Emitter), then the View page will display ERROR SEARCH button to see through the errors.
If the application is created using the JDBC emitters (MYSQL, PostgreSQL, MsSQL, Mem SQL or Oracle), then under the Operation Statistics widget, the below details are available:
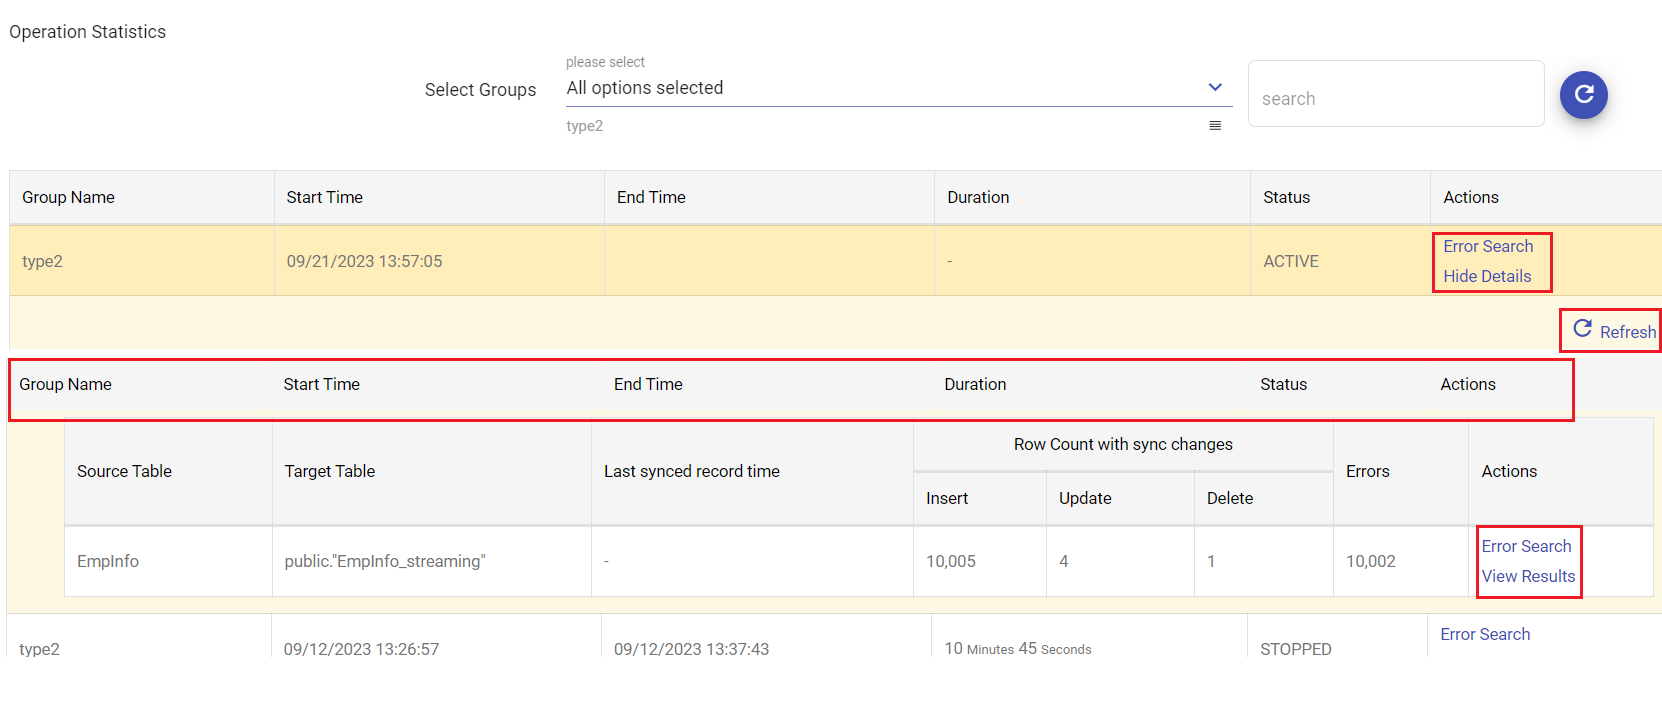
| Field | Description |
|---|---|
| Select Groups | Option to Select All or specific group columns from the drop down list. Option to search specific groups is available. |
| Group Name | Name of the group that is selected under Select Group field. |
| Start Time | The Start timestamp when the application was run will appear. Example: 09/22/2023 11:01:19 |
| End Time | The end timestamp of the application run. |
| Duration | The duration for which the application was running. Example: 15 Hours 23 Minutes 53 Seconds. |
| Status | The run status of CDC application. i.e., ACTIVE/STOPPED. |
| Actions | Error Search and View Details options are available. Upon clicking the Error Search option, the error Search page opens. Upon clicking the View Details option further details are available as explained below. |
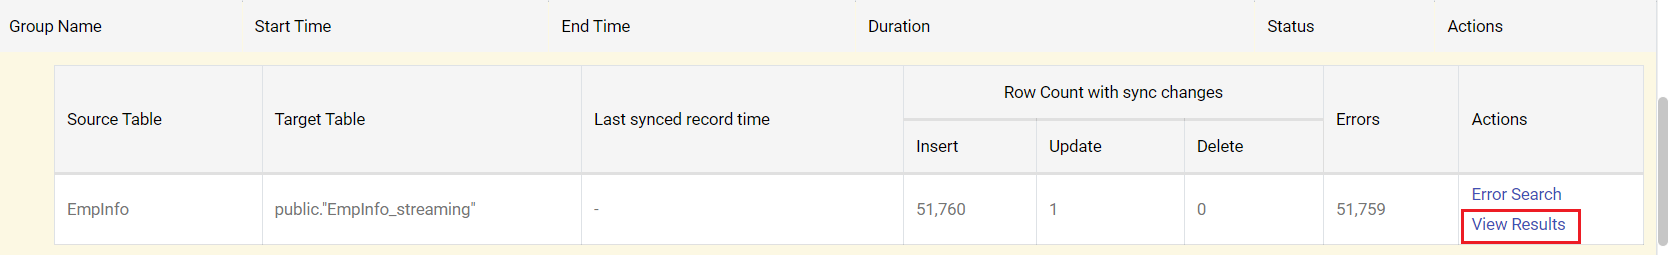
| Source Table | In every grp there can be multiple source tables. |
| Target Table | In every grp there can be multiple targets tables. |
| Last synced record time | The timestamp in which last batch of data got synced to target table. |
| Row Count with sync changes | Insert, Update and Delete detals are available. |
| Insert | The total number of records that were inserted from a source to target will appear. |
| Update | The total number of records that were updated from a source to a target will appear. |
| Delete | The total number of records that got deleted from the target will appear. |
| Errors | The total number of records that are errored will appear. |
| Actions | Error and View Results options are available. |
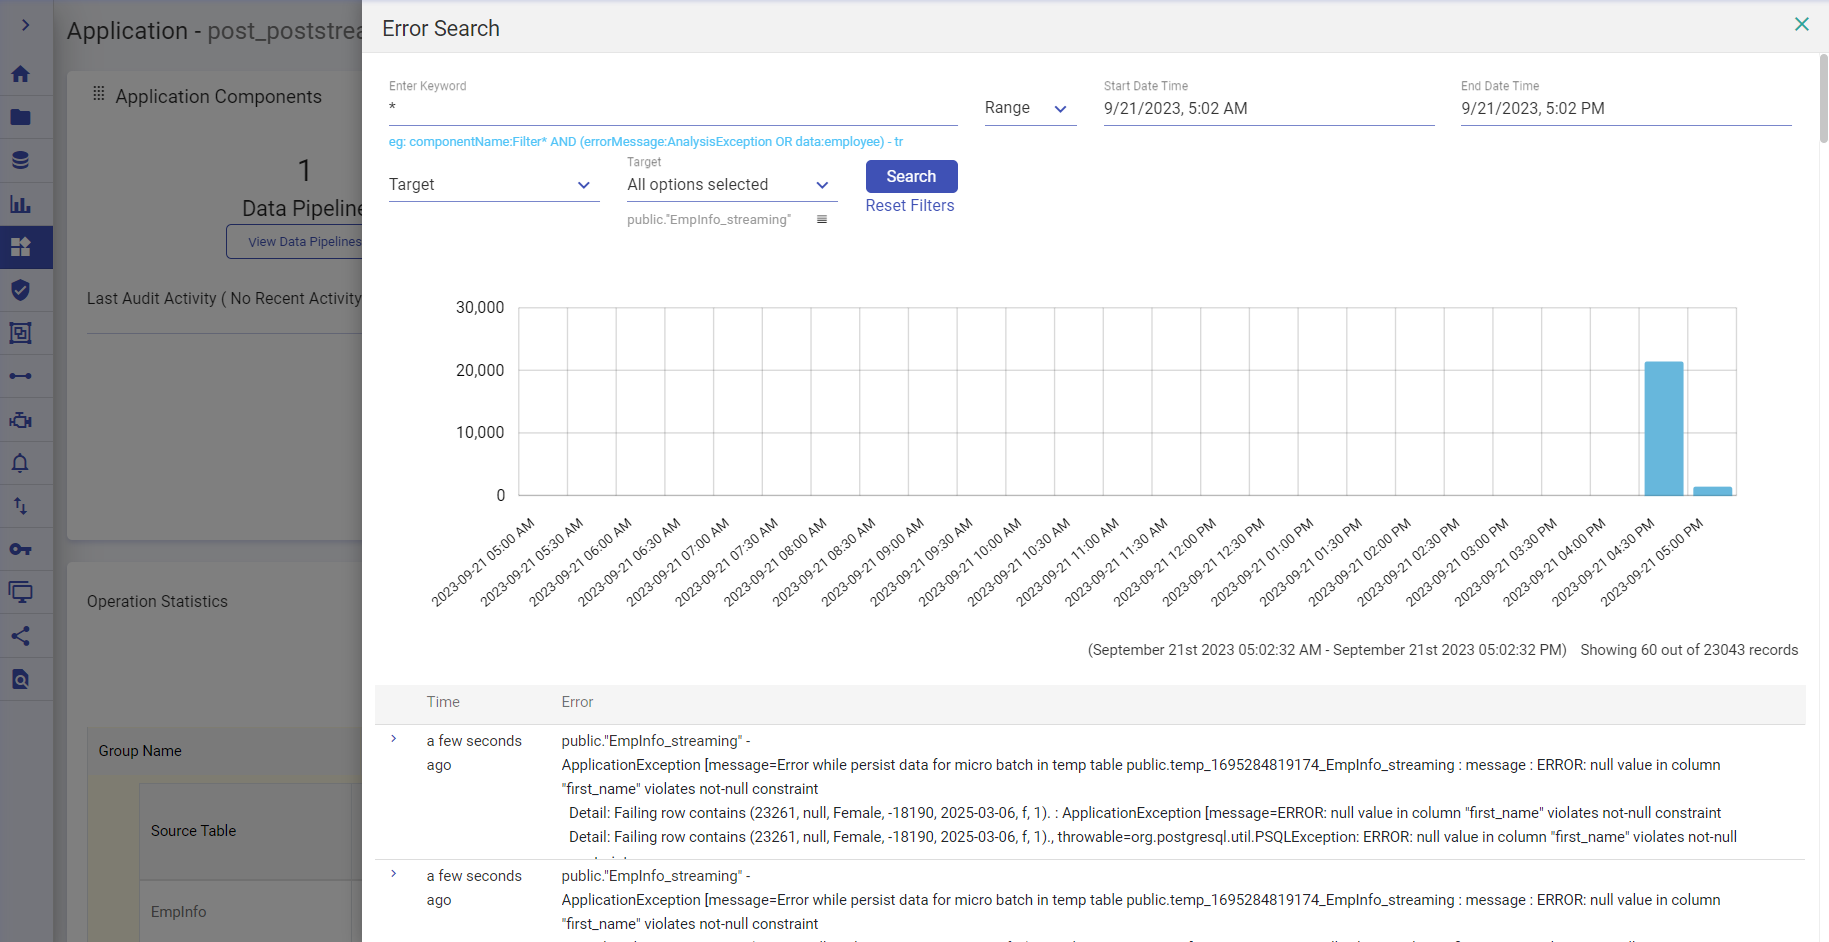
The error search feature can identify erroneous data, pinpoint causes of CDC application breakdowns, and even spot components failing due to specific data.
Additionally, it provides a full stack trace corresponding to any errors detected. Using the error search tab, you can easily see a distribution of errors over time for a CDC application. This feature also allows you to pan and zoom into a specific time range or duration and display results as a histogram distribution. The Error Search option will be visible on the View page only when the JDBC emitters are selected to create the CDC application.
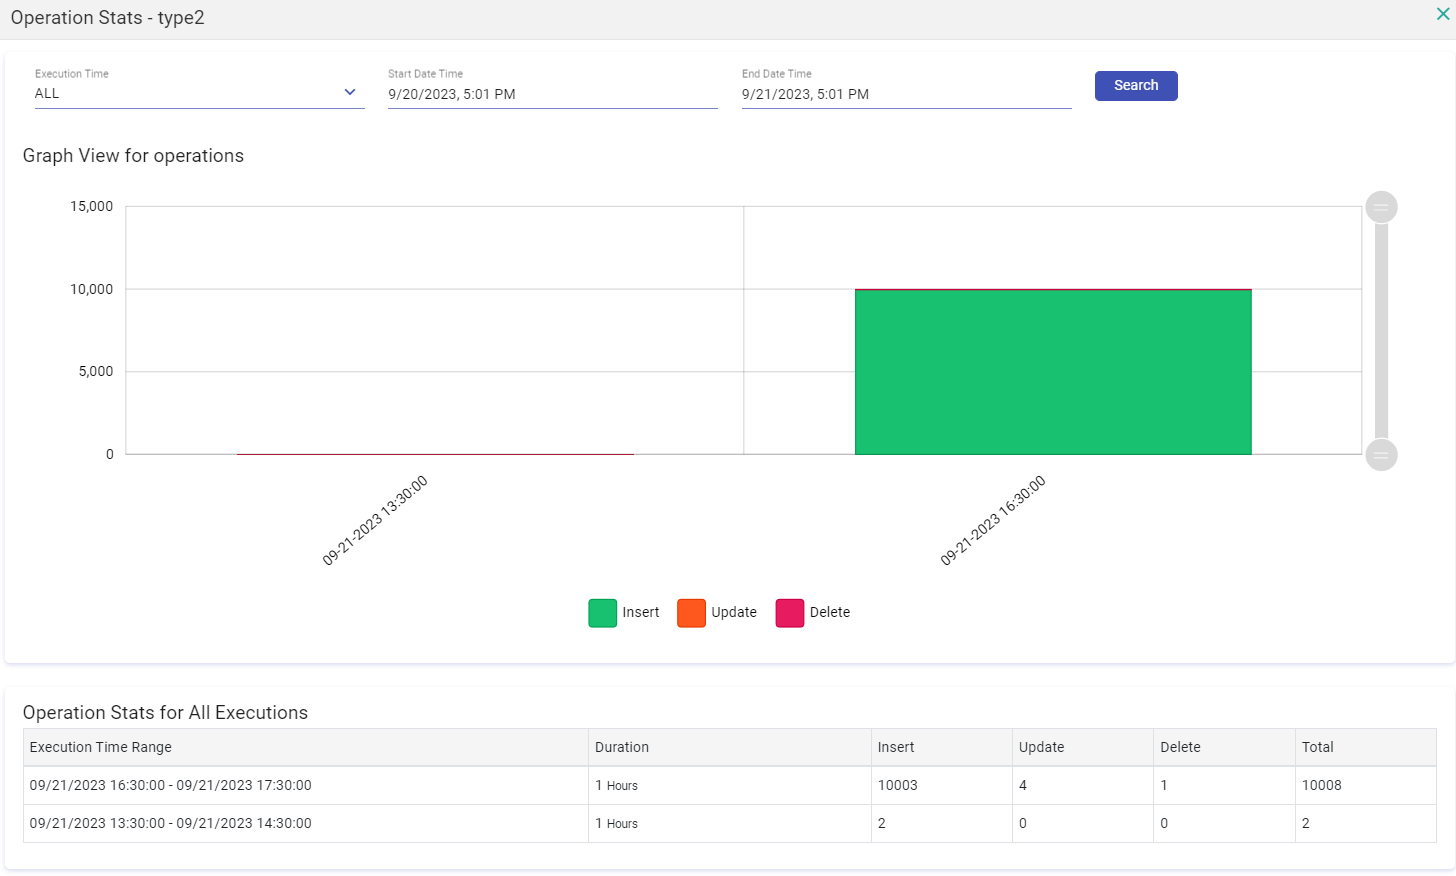
Upon clicking View Results, Graphs for CDC operations allows you to search the CDC app run history. You can Search CDC run history by last run or by by all past runs.
If you have any feedback on Gathr documentation, please email us!