Pipeline Monitoring
Pipeline monitoring provides features like Error Metrics, Query Monitor and Error search for monitoring a pipeline on various metrics.
Prerequisites
The
isMonitoringGraphsEnable(Enable Monitoring Graphs) Flag should be set to TRUE under Managing Configuration > Default > SparkAlso, if SSL is enabled on Default Elasticsearch connection then, import SSL certificate for ES on every machine of the cluster in cacerts keystore in
$JAVA_HOME/jre/lib/security.
You can also configure the Error Handler Configuration section to view errors under graphs.
Click on the ellipsis in the pipeline tile and click on Monitor. You will be redirected to the Monitor page.
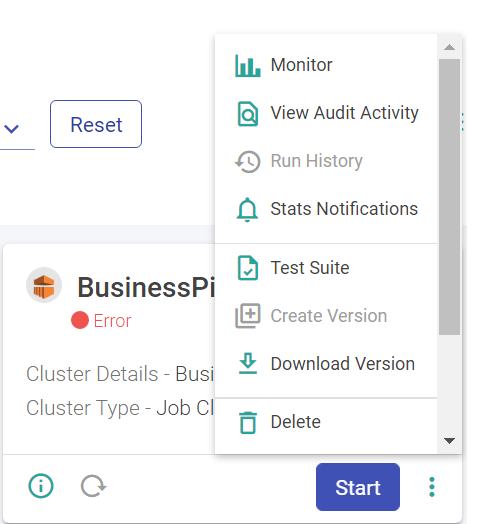
Monitor
Monitor tab has two widgets, Error Metrics and Query Monitor.
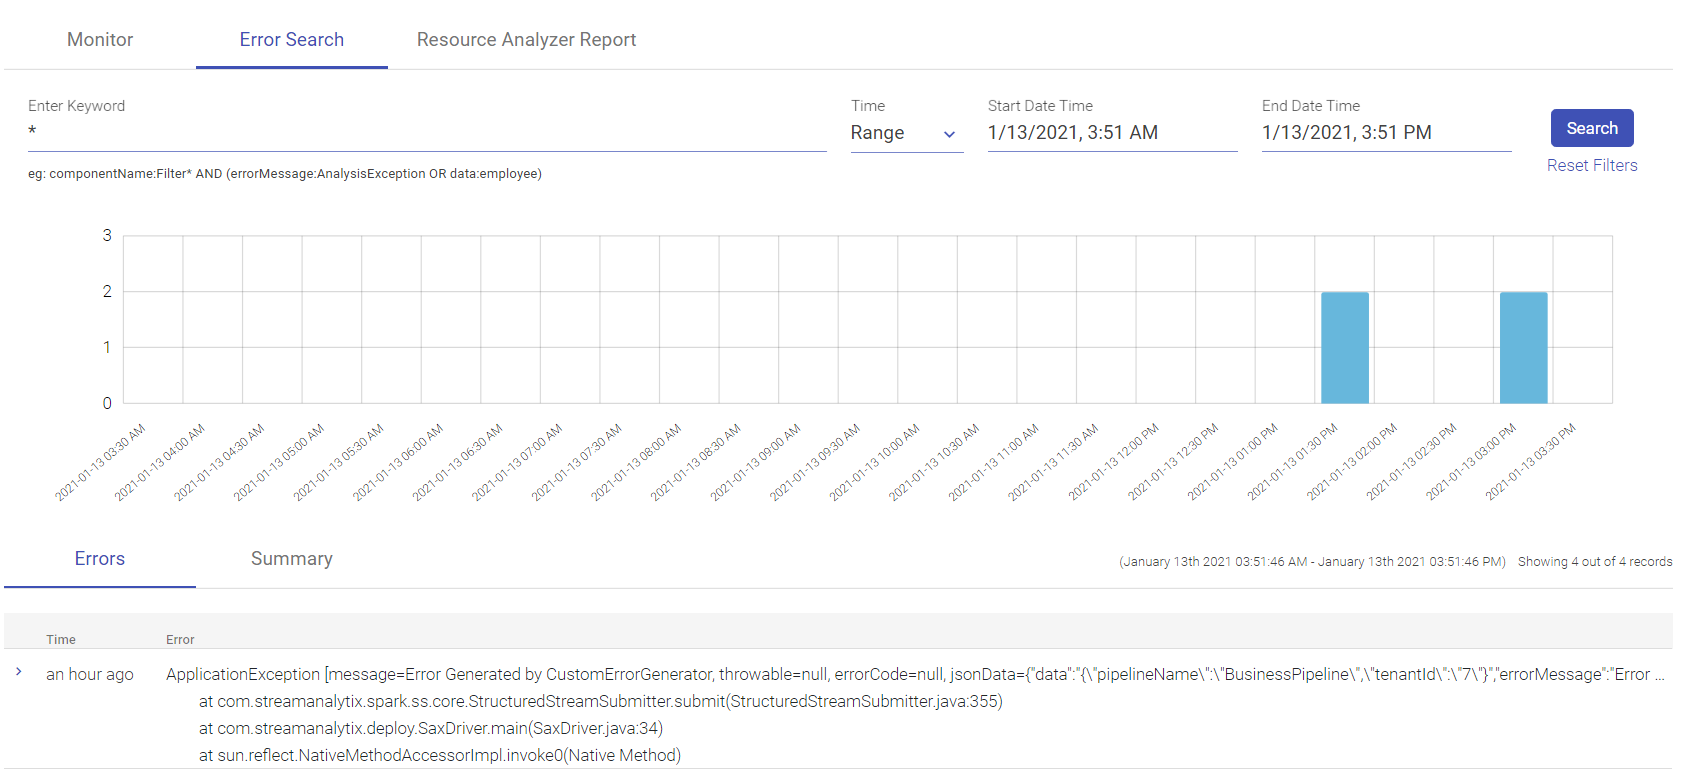
Error Metrics
Error Metrics graph shows a representation of average error rate (mean, 1min, 5mins and 15mins) occurring within the pipeline corresponding to an executor instance.
Query Monitor
Query monitoring shows graphical representation of metrics related to structured streaming query per emitter.
There are three types of graphs that are shown under Monitor, as explained below:
Input vs. Processing Rate
This shows a comparison of how the pipeline is performing with respect to the input rate of data and the actual processing rate of the pipeline.
The input rate specifies rate at which data is arriving from a source (Data Source) e.g. Kafka. Processing rate specifies the rate at which data from this source is being processed by Spark.
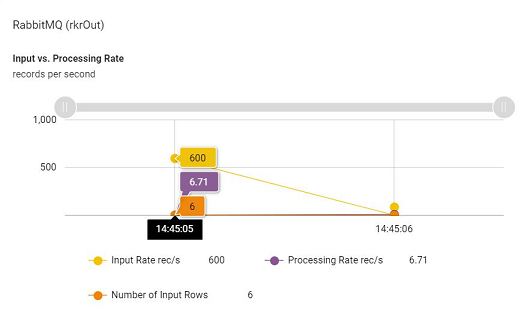
Here, number of input rows defines number of records processed in a trigger execution.
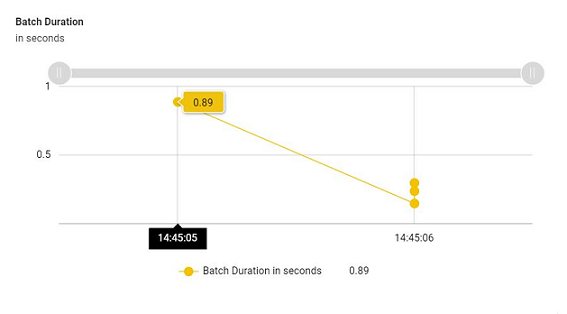
Batch Duration
Approximate time in to process this over all micro-batch (trigger) in seconds.
This shows a time series representation of how the micro batches of the pipelines are performing with respect to time. It helps in identifying if there has been any bottleneck in the processing of a micro batch in the past.
Aggregation State (optional)
Shows aggregation state of current streaming query, if the pipeline has an aggregation processor.
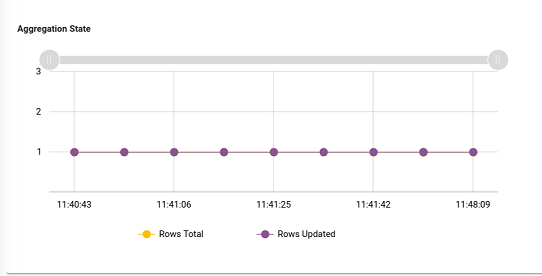
It shows information about the operator query that stores the aggregation state.
If you have any feedback on Gathr documentation, please email us!