Resource Analyzer Report
Resource Analyzer report provides “profiling” and a “analyzer report” of your pipeline so that you can evaluate the efficiency of allocated resources.
This helps in identification of “optimum resources required” and “scalability limits” for the pipeline performance.
The resource analyzer report has four pages that shows different parameters of the pipeline performance.
Efficiency Statistic
Graphs under Efficiency statistics shows current performance of pipelines.
It has three types of graphs:
Driver vs Executer graph
Driver vs Executer graph shows the wall clock time of driver and executer. It has the following properties:
| Field | Description |
|---|---|
| Driver wall clock time | Time spent in driver alone. |
| executor wall clock time | Time spent in executors. |
| Total wall clock time | The total spark application wall clock time can be divided into time spent in driver and time spent in executors. |
Critical and Ideal graph
Critical and Ideal graph shows the time taken by a pipeline in different cases.
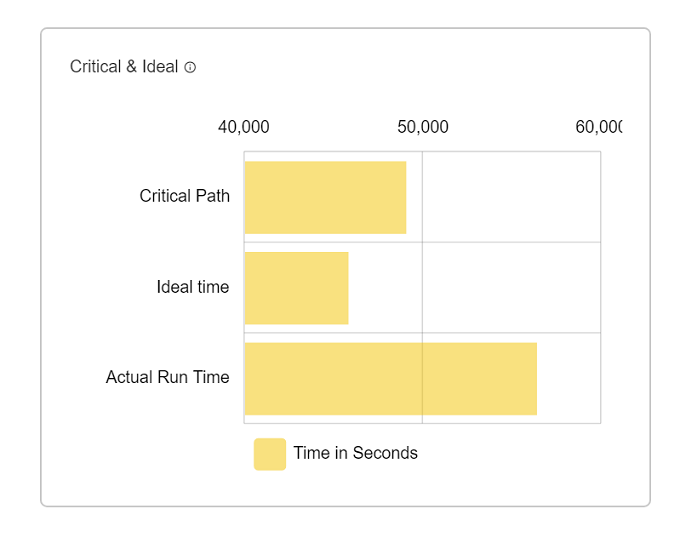
| Field | Description |
|---|---|
| Actual runtime | Actual time take by pipeline when execute with single executer & one core. |
| critical path time | Critical path time is the minimum time that this application will take even if we give it infinite executors. |
| Ideal Application Time | Ideal application time is computed by assuming ideal partitioning (tasks = cores and no skew) of data in all stages of the application. |
OCCH Graph (Core Compute Hours)
A core-hour is a measurement of computational time. In OnScale, if you run one core CPU for one hour, that’s one core-hour. If you run 1000 CPUs for 1 hour, then that’s 1000 core-hours.
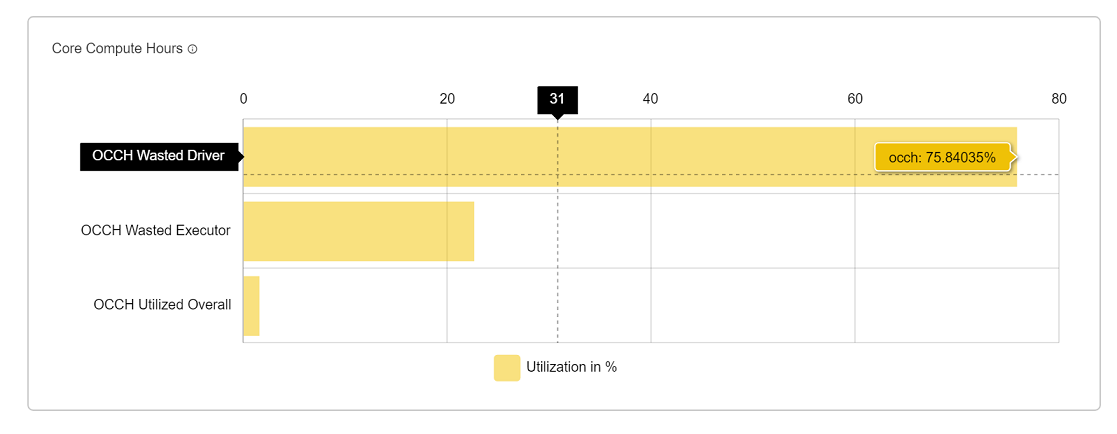
| Field | Description |
|---|---|
| OCCH Driver wastage | OCCH wastage by driver in percentage. |
| OCCH executer wastage | OCCH wastage by executer in percentage. |
| Total wastage | Driver wastage + executer wastage. |
Aggregate Metrics
It frameworks the report of data for each task in the application.
Shown below are parameters such as min, max, sum and mean of all the stages and jobs in the application.
| Field | Description |
|---|---|
| Disk Bytes Spilled | Size of spilled bytes on disk (can be different if compressed) |
| Executor Runtime | Total time spent by executor core running this task |
| Input Bytes Read | Number of bytes read by a task (using read API’s) |
| JvmGCTime | Amount of time spent in GC while this task was in progress |
| Output Bytes Written | Number of bytes written by a task (using write API’s) |
| Peak Execution Memory | Maximum execution memory used by a task |
| Result Size | The number of bytes sent by the task back to driver |
| Shuffle Read Bytes Read | Total bytes read by a task for shuffle data |
| Shuffle Read Fetch WaitTime | Time spent by the task waiting for shuffle data |
| Shuffle Read Local Blocks | Total records read by a task for shuffle data |
| Shuffle Read Local Blocks | Shuffle blocks fetched from local machine (disk access) |
| Shuffle Read Remote Blocks | Shuffle blocks fetched from remote machine (network access) |
| Shuffle Read Remote Blocks | Number of bytes that were spilled to disk during the task |
| Shuffle Write Bytes Written | Total shuffle bytes written by a task |
| Shuffle Write Records Written | Total shuffle records written by a task |
| Shuffle Write Time | Amount of time spent in a task writing shuffle data |
| Task Duration | Total time spent by the task starting from its creation |
Simulation
Using the fine grained task level data and the relationship between stages, in this we can simulate how the application will behave when the number of executors is changed. Specifically It will predict wall clock time and cluster utilization.
Note that cluster utilization is not cluster CPU utilization. It only means some task was scheduled on a core. The CPU utilization will further depend upon if the task is CPU bound or IO bound.
Stage Metrics
It shows the complete information about a stage.
| Field | Description |
|---|---|
| Stage id | It is the id of a stage. |
| wallclock% | It is the percentage of time of a stage with respect to overall time by pipeline. |
| task count | how many task in stage. |
| wallclock time | total time by stage in ms. |
| maximum Task memory | maximum memory taken by any task of stage. |
| PRatio | Number of tasks in stage divided by number of cores. Represents degree of parallelism in the stage. |
| TaskSkew | Duration of largest task in stage divided by duration of median task.Represents degree of skew in the stage. |
| IO% | Percentage between total memory used by stage to total memory used by pipeline in execution. |
| Task Runtime%:- | Total time spent by the task during execution on the executor. |
| Input | Input bytes read by stage. |
| Output | Output bytes written by stage. |
| Shuffle-Input | Shuffle data during read by stage. |
| Shuffle-Output | Shuffle data during written by stage. |
| WallClockTime Ideal | Time required by stage for ideal application. |
| OneCoreComputeHours Available | Total compute hours for this stage. |
| OneCoreComputeHours Used% | Compute hours used in this stage. |
| OneCoreComputeHours Wasted% | Compute hours wasted in this stage. |
| Task StageSkew | Duration of largest task in stage divided by total duration of the stage. Represents the impact of the largest task on stage time. |
| OIRatio | Output to input ratio. Total output of the stage (results + shuffle write) divided by total input(input data + shuffle read). |
| ShuffleWrite% | Amount of time spent in shuffle writes across all tasks in the given stage as a percentage. |
| ReadFetch% | Amount of time spent in shuffle read across all tasks in the given stage as a percentage. |
| GC% | Amount of time spent in GC across all tasks in the given stage as a percentage. |
If you have any feedback on Gathr documentation, please email us!