Datasets List
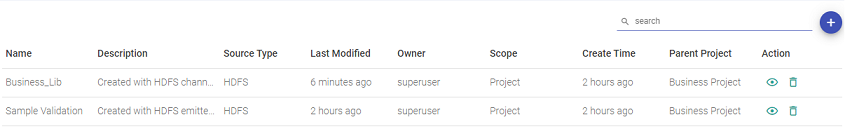
The Dataset homepage shows a list of all the Datasets created. The below screenshot shows the same with the properties and description table below:
| Property | Description |
|---|---|
| Name | Name of the dataset. |
| Description | Description of the dataset. |
| Source Type | Data source type. |
| Actions | When you click on the eye icon, a view-dataset window opens. This is the page where you can view the schema of the dataset, versions of the dataset and other options explained below in hierarchal form. |
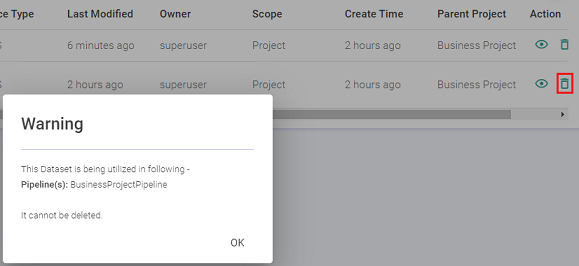
| Delete | A new option to delete a Dataset is being introduced. Datasets that are not being used in any pipeline or validation jobs can be deleted with this new option. An existing Dataset that is being consumed by any pipeline or validation jobs cannot be deleted unless it is removed from its associated pipeline or validation job. |
View Dataset
Click on the view dataset eye icon under the Actions tab of the Dataset homepage. A window will open with the details of the dataset, with two following tabs; Summary and Explore.
Summary
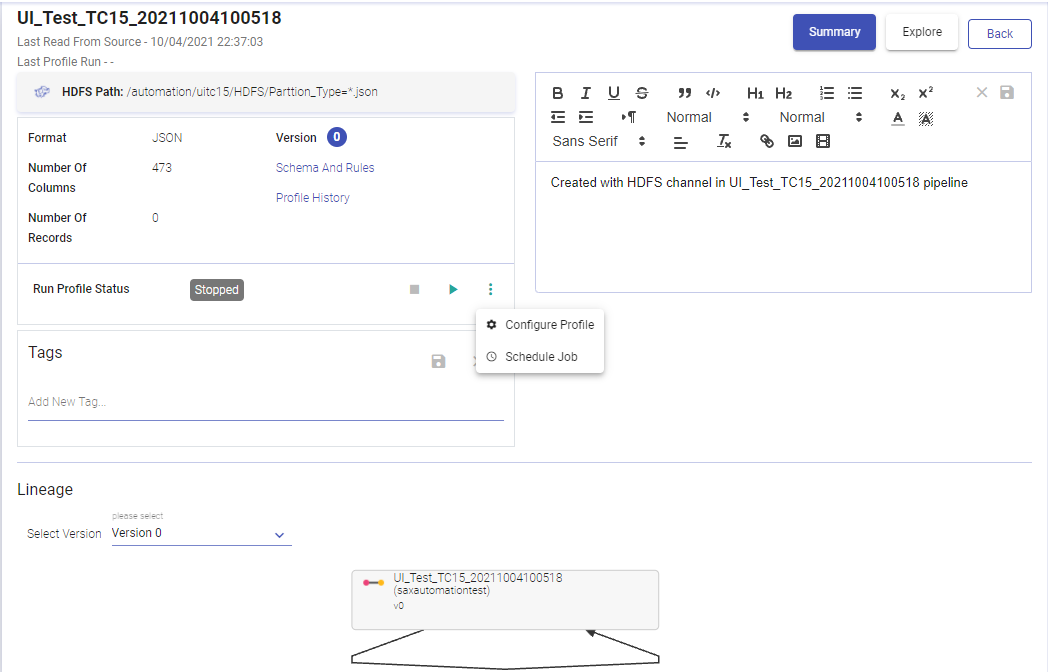
The Summary button shows the summary of your Dataset. The right panel is the description window, which can be edited and saved in the same window. Left Panel has the Data Source or Emitter Dataset details, where you can view schema details, connection detail and other properties, explained in the table below:
The screenshot under View Dataset, shows the Dataset details and active version of DFS Data Source, under the About button. Below mentioned table describes all the properties of the Summary tab button.
| Property | Description |
|---|
Dataset Name
| Last Read From Source | Last time the data was read from the data source. The date and time are mentioned here. |
| Last Profile Run | It shows when the last Dataset profile was generated. The profile is generated when you run the dataset profile from Run Profile. |
| File Path | The file path and the format of data type, where the data will be read while generating profile. In few components, HDFS path is replaced by Query/ Database name or Table name and the configured query is reflected here. For example, in case of JDBC, the query mentioned here will run while generating the profile. In case of HDFS, the configured path is where the data will be read from. Note: All the above properties should be re-configured when a new dataset version is created. |
| Number of Columns | Number of columns from the data. |
| Number of Records | The total number of records when the last profile was generated in the data source. |
| Schema and Rules | This click-able button opens a window at the bottom of this pane and displays the versions and corresponding rules applied on the dataset. In the Schema window, you can view the Alias and the Datatype of the schema. |
| Profile History | Number of times the profile was generated. You can view the respective results. |
| Version | The latest version of the dataset. |
| Run Profile Status | This tab shows the current state of the profile, for if it is in execution state or stopped state. There are two buttons, Play and Stop. These buttons allow you to play and stop the profile. The menu button, has two options: Schedule Job Configure Job They are explained below. |
| Tags | Associate tags with the dataset. Tags can also be updated from the same window. |
| Description | The description provided while creating a dataset. You can edit the description within this window, and a “Description updated successfully” message will pop-up. |
Dataset Lineage
| Select Version | Select the version of the dataset that you want to view. |
| Alias | Name of the fields |
| Datatype | Datatype of the field (Int, string) |
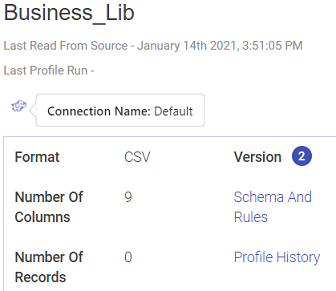
When you do a mouse-hover on the Path details, it gives the name of the connection, as shown below:
Schema
Schema opens a new window beneath the Schema panel. Select the Versions of the dataset and it will list the Aliases with their Data Types.
Profile History
Profile History opens a new window beneath the View Schema panel. A tabular form of profile history is shown with details of the Dataset profile:
| Property | Description |
|---|---|
| Version | Version number of the Dataset. |
| Number of Columns | Number of columns in the Dataset. |
| Number of Records | Number of records in the Dataset |
| Last Profile Run | The date and time on which the Profile was run. |
| Action | View the profile results. |
Run Profile Status
Run Profile Status shows the current state of the profile execution, for if it is in Starting/Active/or Stopped mode.
You can Stop and Play the profile using the respective buttons as well.

A pipeline gets submitted on the cluster. This pipeline will have a nomenclature as explained below:
System prefix of the Pipeline_Dataset Name_DatasetVersion_Timestamp.
For example, SAx\_DatasetProfileGenerator\_IrisInputData\_0\_1559296535220
This pipeline will be submitted as a batch job in the cluster.
The options available under Run Profile Status are:
| Property | Description |
|---|---|
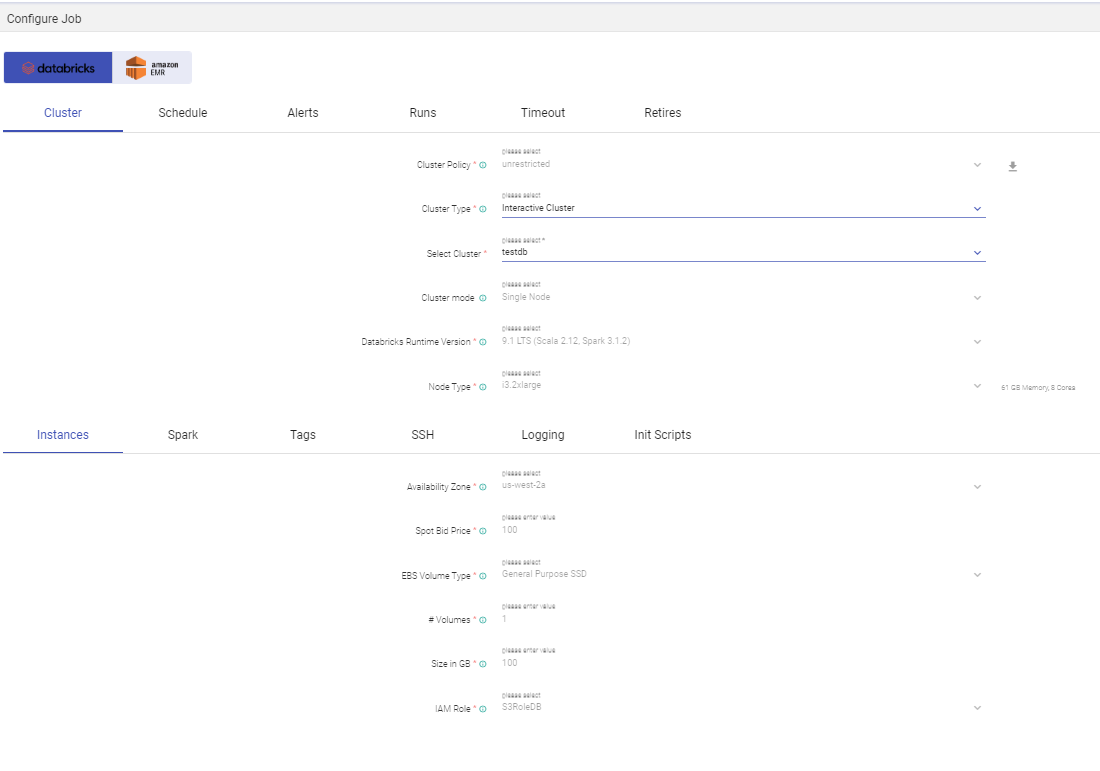
| Cluster Configuration | The details of cluster configuration is available. |
| Configure Job | The configure Job window opens. Below options are available on the Configure Job window. |
| Name | Description |
|---|---|
| Select Cluster | Select IBM Conductor cluster for job configuration. |
| Instance Group Name | Select Instance Group to configure spark job. |
| Spark Master Url | Master URL to submit or view spark job. |
SPARK CONDUCTOR EGO PROPERTIES
IBM Conductor EGO Configuration
| Name | Description |
|---|---|
| Executor Maximum Slots | Maximum number of executor slots. |
| Executor Idle Time | Specifies the duration (in seconds) for executor state to remain alive without any workload running on it. |
| Maximum Slots | Specifies maximum number of slots that an appication can get in master node. |
| Slots Per Task | Specifies number of slots that are allocated to a task. |
| GPU Max Slots | Specifes maximum number of slots that an application can get for GPU task in a master node. |
| Priority | Specifies the priority of driver and executor scheduling for spark instance group. Valid range is 1-10000. Default is 5000. |
To add Environment Variable, click the ADD ENVIRONMENT VARIABLE BUTTON. Option to ADD CONFIGURATIONS is also available.
Click CONFIRM once details are provided in the Configure Job window.
|Stop|Number of records in the Dataset| |Run Profile |The date and time on which the Profile was run.|
Along with executing the profile, you can also configure the job and schedule the job, as explained below:
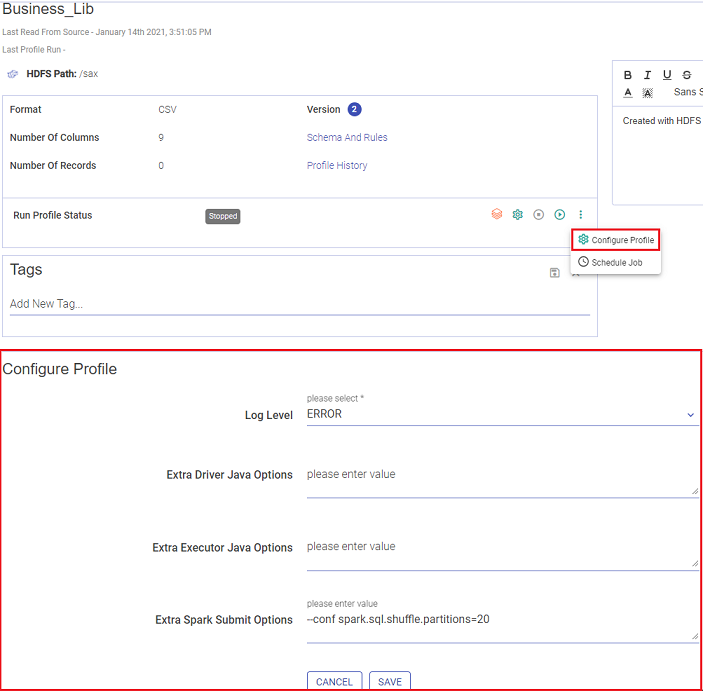
Configure Profile
User can tune the job in this window by providing driver and executer related parameters. To know more, see the Configure Profile field in the table Actions on Pipeline.
To check the errors on this job, you can also configure error properties from this window.
Schedule Job
Schedule job enables a dataset to run a Job as per the defined cron expression.
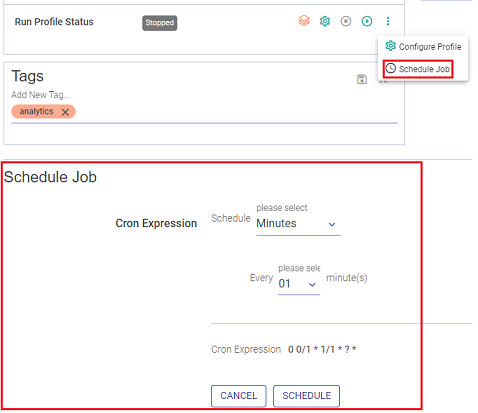
Once you are defining a cron expression, you will have the option to Schedule a job and once it is scheduled, then an UN-SCHEDULE and RESCHEDULE button will be available.
Dataset Lineage
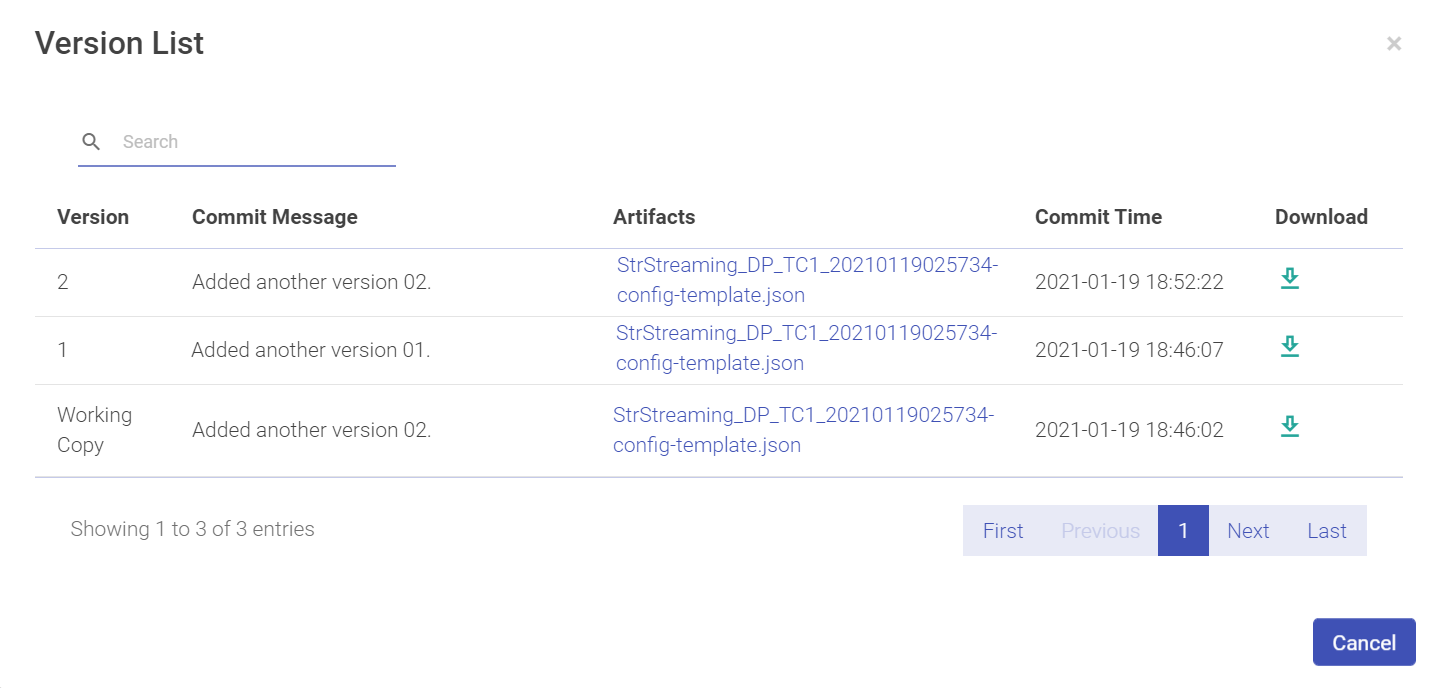
The Dataset Lineage window lists all the versions of the dataset and its complete life cycle.
You can view the dataset lineage by selecting the version. Data Lineage represents the association of the dataset in the pipeline. It shows the used channel or emitter used within the data pipeline.
An association is defined if dataset schema and rules are used in the channel. This helps to use the same entities in multiple pipeline channels, as Use Existing Dataset.
In the case of an emitter, only the schema part of a dataset is associated.
So on, the life-cycle of the dataset is shown under the lineage page.
Represents the flow of a dataset in the system with pipelines.
Initially, a basic lineage is shown. Then you have the option to expand the dataset or pipeline lineage to get more parent-child associations and flows.
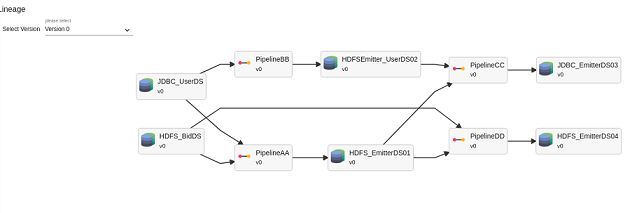
It is visible on the Summary screen. The below example shows the lineage as follows:
JDBC_UserDS is used in PipelineBB, PipelineAA as channel
HDFS_EmitterDS01 is created by save as dataset in emitter of PipelineAA. Used as channel in PipelineCC and Pipeline DD
The dataset to pipeline arrow signifies that the dataset is used in the pipeline as a channel.
The pipeline to dataset arrow represents that the dataset is saved in the emitter of the pipeline.
Explore
It generates details about the data in the data window. Under Explore are two tabs:
Data
Profile
Data
Under the Data tab, you can view the rules, and the dataset with schema. This tab is explained under Rules.
Profile
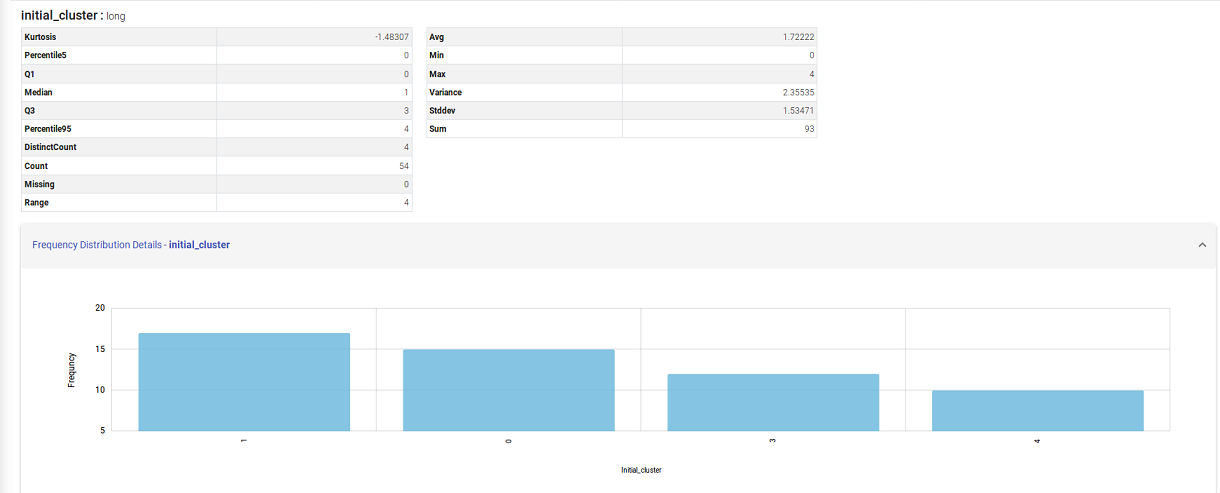
The profile pane lists all the variables in your Dataset. This section also shows various statistical insights on each variable like Avg, Min, Max, Percentile, etc. You can also click on the ‘Frequency Distribution Details’ Label to see the frequency distribution corresponding to every variable.
Frequency Distribution Details:
Frequency distribution of any attribute/field is the count of individual values for that field in whole Dataset.
For Numeric type fields, it is shown in terms of counts only.
For String/Date/Timestamp: You can view the frequency/counts along with its percentage.
By default, only 10 distinct values are shown. But, it can be changed by updating sax.datasets.profile.frequency.distribution.count.limit from the Superuser Configuration.
As shown below, you can click on the bar of Frequency Distribution and it expands with a graph.
The Frequency Distribution Graph is generated for every variable in the dataset.
If you have any feedback on Gathr documentation, please email us!