Creating a Spark Pipeline
On the Pipeline canvas, user can ingest and blend incoming data (batch/streaming) from any source, process the data, apply ML algorithms as per the use case and emit in the required emitter/data warehouse/storage system by leveraging the 300+ built-in operators.
A data pipeline can be created within a desired project. To know more about various options available inside projects in Gathr, see Projects →
To create a data pipeline, click the Create New Pipeline button, on the Pipeline Listing page.
Once you click the Create New Pipeline button, the pipeline canvas gets displayed.
You can create a pipeline by selecting a preferred Data Source and configure it.
This data as per your business use case can further be cleansed and enriched using various available processors and ML algorithms. Finally you can emit the data in the Target of your choice.
To know more about various supported components by Gathr see, Data Sources, Processors, Data Science and Emitters.
Once you have navigated to the Pipeline page from the options listed inside Project, you can create a new pipeline or edit an existing pipeline through the pipeline listing page.
As mentioned above, once you click on the +icon at the right of the Pipeline listing screen, you are ready to create a pipeline on the grid-canvas.
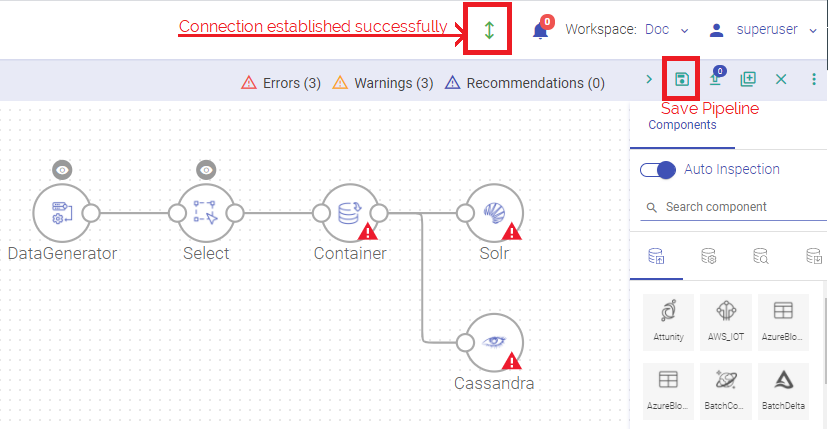
Make sure that a connection is established either on Cluster (i.e., create spark session on yarn cluster node) or Local system. The green arrow above the pipeline canvas denotes that the connection is established.
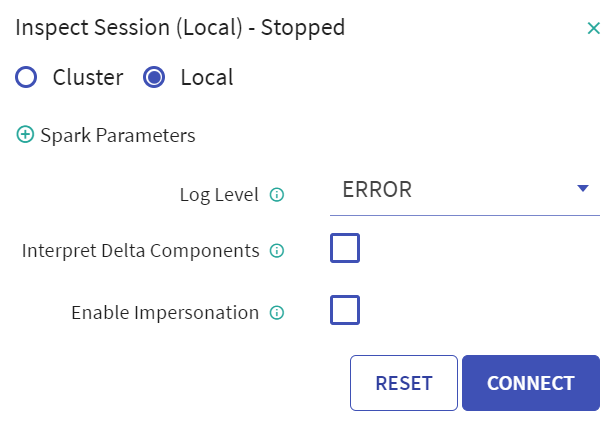
- You can dynamically change the log level during pipeline inspect.
Select components on the pipeline grid-canvas from the right panel and connect the components.
Select by clicking on a component to configure its properties.
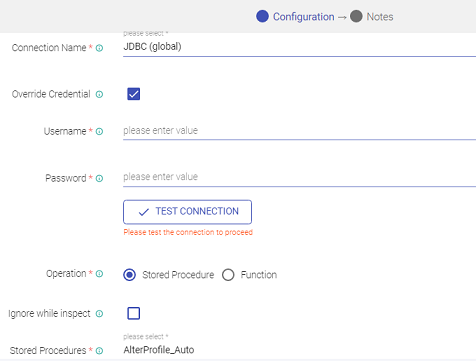
The components that require connection details have an option to select the connection name from the existing list of connection templates.
You can, while configuring component properties, check-mark the Override Credential box to override existing connection credentials.
In such scenarios you will need to provide any other valid credential details through which the component connection can be authenticated.
Once the configuration is done, click on the floppy icon to save the pipeline.
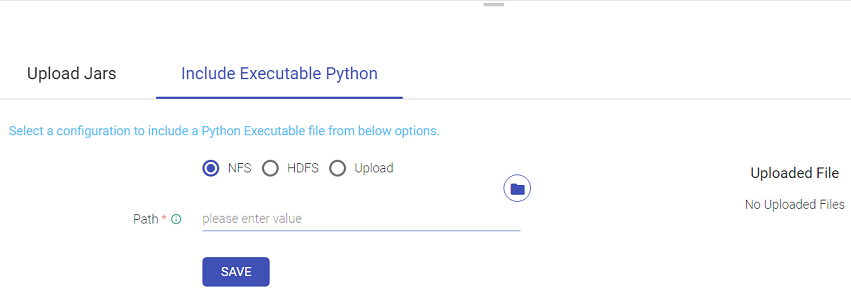
Upload Jars/Include Executable Python
You have an option to upload Jars or include Executable Python file in the Data Pipeline configuration.
To upload Jars click on the Upload Jars icon and then on the Upload Jars tab do as follows:
Click on the upload icon and select files to be uploaded.
To include Executable Python files do as follows:
There are three options out of which any one can be selected to include the Executable Python file.
| Option to include Executable Python file | Description |
|---|---|
| NFS | Provide the path of the desired pex file to be Uploaded and save it. |
| HDFS | Provide the connection and path of the desired pex file to be Uploaded and save it. |
| Upload | Upload the desired pex file from the desktop. |
- Save button is provided in the NFS and HDFS pex file upload options whereas in Upload option, once the file is uploaded it is automatically saved.
- Delete option can be used for NFS, HDFS & Upload options to delete any of the existing pex file and then re-upload a new one.
- At a time, a single pex file can be associated with a pipeline, linking a new pex file will override the existing one.
- In case of Pipeline Import/Clone, Pex File Configuration will be visible in case if the pex file is provided either by NFS or HDFS option. User can specify the path for the pex file upload.
- If user wants to add pex file via Upload option, it can be only done by editing the imported or cloned pipeline later.
Enable Impersonation
Enable impersonation from the inspect session arrow window within a workspace.
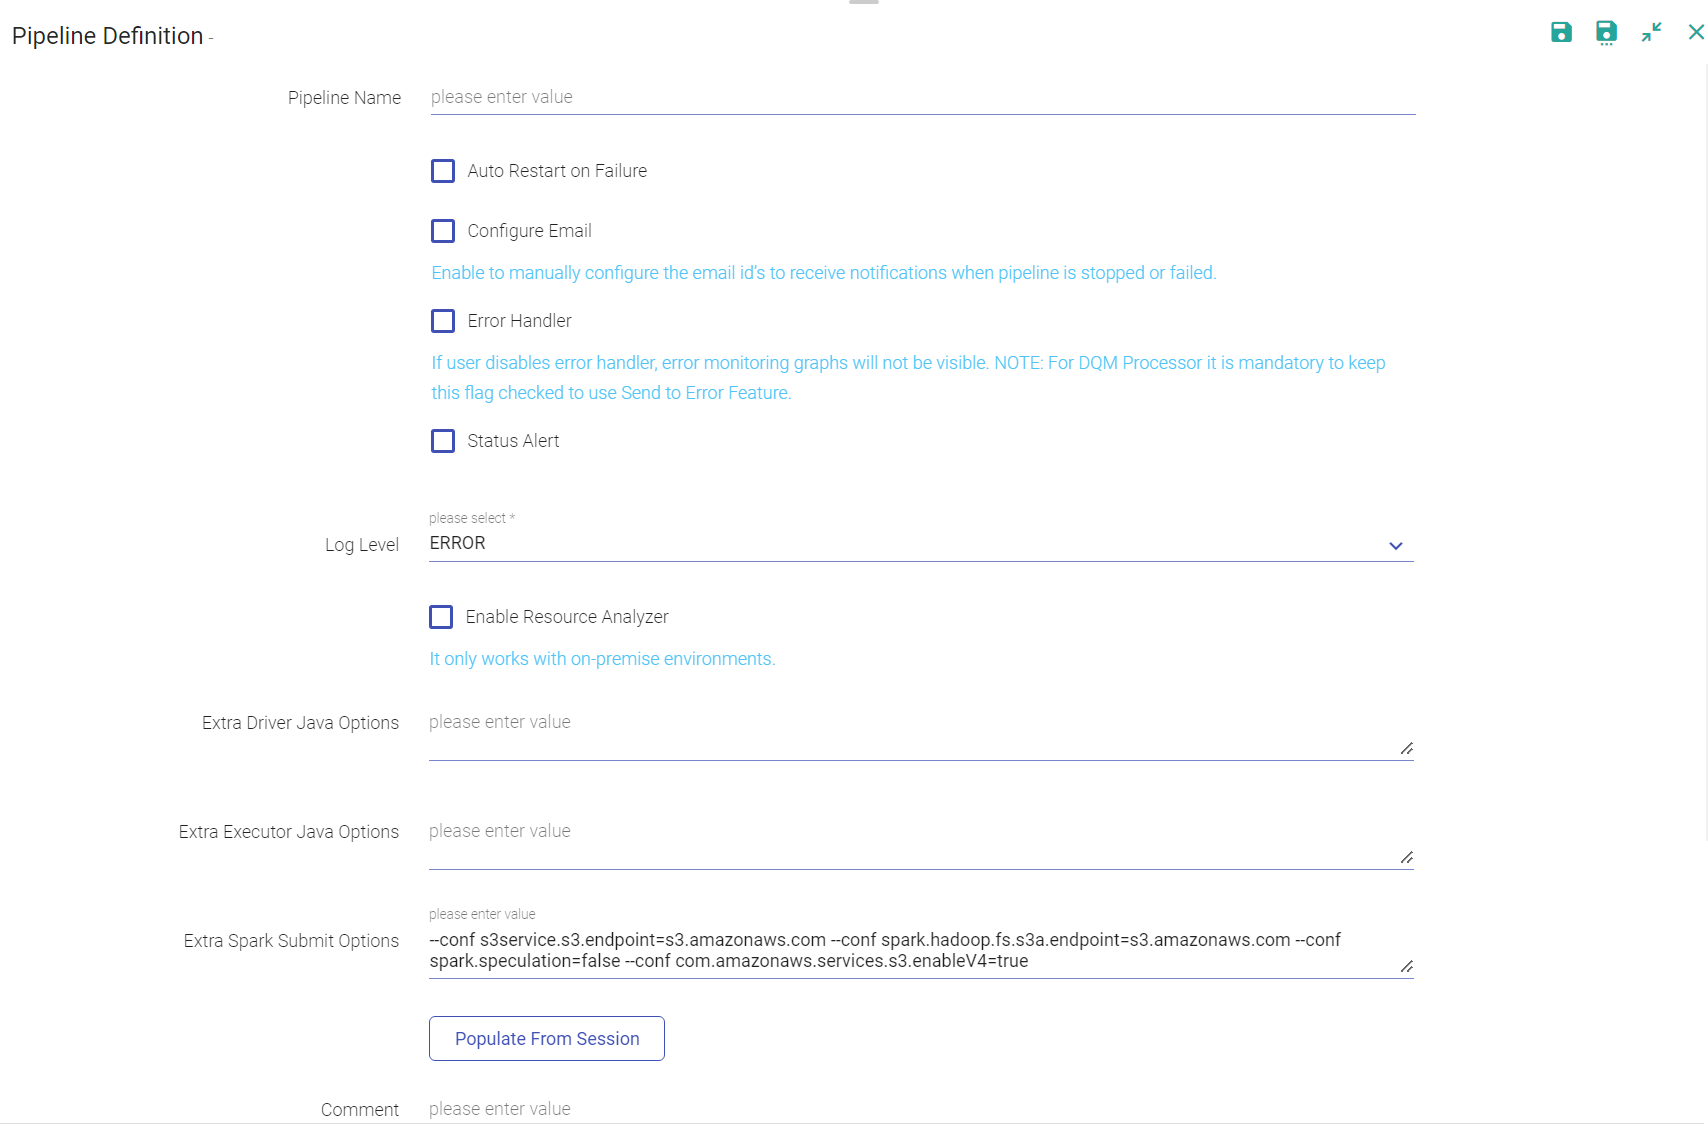
Enter the details of the pipeline in Pipeline Definition window.
The pipeline definition options are explained below:
When you click on MORE, the below mentioned configuration appears:
If a streaming pipeline fails to successfully run, you can reschedule and restart the pipeline and will have to configure the pipeline. Click on the pipeline tile ellipses and select Pipeline configuration/Edit options. You can also specify the auto restart pipeline option while importing/exporting a pipeline.
| Field | Description |
|---|---|
| Pipeline Name | Name of the pipeline that is created. |
| GIT Repo HTTP URL | The Git repository HTTP URL. |
| GIT Branch | The branch in the git repository where the pipeline will be committed. The GIT actions are disabled if you enter a workspace with superuser credentials. Only the user that has GIT credentials can commit to the branch. |
| HDFS User | Yarn user by which you want to submit the pipeline. |
| Key Tab Option | You can Specify a Key Tab Path or Upload the Key Tab file. |
| Key Tab File Path | If you have saved the Key tab file to your local machine, specify the path. |
| Error Handler | Enable error handler if you are using Replay data source in the pipeline. Selecting error handler check-box displays configure link. Clicking on the configure link displays error handler configuration screen. |
| Log Level | It controls the logs generated by the pipeline based on the selected log level. Trace: View information of trace log levels. Debug: View information of debug and trace log levels. Info: View information of trace, debug and info log levels. Warn: View information of trace, debug, warn and info log levels. Error: View information of trace, debug, warn, info and error log levels. |
| Comment | Write notes specific to the pipeline. |
| Deployment Mode | Specifies the deployment mode of the pipeline. Cluster: In cluster mode, driver runs on any of the worker nodes. Client: In client mode, driver runs on the Gathr admin node. Local: In local mode, driver and the executors run on the Gathr admin container. |
| GIT Repo HTTP URL | The Git repository HTTP URL. |
| GIT Branch | The branch in the git repository where the pipeline will be committed. The GIT actions are disabled if you enter a workspace with superuser credentials. Only the user that has GIT credentials can commit to the branch. |
| HDFS User | Yarn user by which you want to submit the pipeline. |
| Key Tab Option | You can Specify a Key Tab Path or Upload the Key Tab file. |
| Key Tab File Path | If you have saved the Key tab file to your local machine, specify the path. |
| Configure Email | Check the box to configure email in case of pipeline failure. |
| Email IDs | Provide comma-separated email id’s for receiving email notification for pipeline failure. |
| Error Handler | Enable error handler if you are using Replay data source in the pipeline. Selecting error handler check-box displays configure link. Clicking on the configure link displays error handler configuration screen. To know more about Error Handler see, Error Handler Configuration. |
| Status Alert | Enable Status Alert if you want to send Alert/Message to a Kafka Topic for any change in the pipeline status. To know more about Error Handler see, Status Alert Configuration. |
| Log Level | It controls the logs generated by the pipeline based on the selected log level. Trace: View information of trace log levels. Debug: View information of debug and trace log levels. Info: View information of trace, debug and info log levels. Warn: View information of trace, debug, warn and info log levels. Error: View information of trace, debug, warn, info and error log levels. |
| Yarn Queue | The name of YARN queue on which the application is submitted. |
| Auto Restart on Failure | Check the option for restarting failed streaming pipelines. - Max Restart Count: The maximum number of times the user wants to configure the pipeline. - Wait Time Before Restart: Waiting time before the pipeline is again restarted (in minutes). - Pending Restart Attempts: Number of pending restart attempts. |
| Configure Email | Check the option to enable the Configure Email option. Provide comma-separated email id(s) to receive notifications when pipeline is stopped or failed. |
| Publish Lineage to Cloudera Navigator | Publish the pipeline to Cloudera environment. (Only if the environment is CDH enabled.) |
| Create Version | Creates new version for the pipeline. The current version is called the Working Copy and rest of the versions are numbers with n+1. This is in case Version Control System under Set Up is selected as Gathr Metastore. |
| Comment | Write notes specific to the pipeline. |
MORE PROPERTIES
| Deployment Mode | Specifies the deployment mode of the pipeline. Cluster: In cluster mode, driver runs on any of the worker nodes. Client: In client mode, driver runs on the Gathr admin node. Local: In local mode, driver and the executors run on the Gathr admin container. |
| Driver Cores | Number of cores to be used for the driver processes. |
| Driver Memory | Amount of memory to use for the driver processes. |
| Driver PermGen Size | Holds reflective data of the VM. Such as class objects and method objects. These reflective objects are allocated directly into the permanent generation, and it is sized independently from other generation. |
| Application Cores | Number of cores allocated to spark application. It must be more than the number of receivers in the pipeline. It also derives the number of executors for your pipeline. No. of executors = Application Cores/ Executor cores. |
| Executor Cores | Number of cores to be used on each executor. |
| Executor Memory | Amount of memory to be used per executor process. |
| Dynamic Allocation Enabled | When a pipeline is in running mode, the spark pipeline scale and scale down the number of executors at the runtime. (Only in case of CDH enabled environment). |
| Parallel Execution | Enable checkbox to execute pipeline in parallel manner. Disable checkbox to execute pipeline in sequential manner. In a pipeline if you have a batch source connected with multiple emitters, you have an option to execute the query and emit the data in a parallel way unlike in sequential manner where the query would be executed one after another. |
| Enable Resource Analyzer | Enable to get insight for resource utilization of the pipeline. (Available on the Unlimited environment). |
| Extra Driver Java Options | A string of extra JVM options to pass to the driver. For instance, GC settings or other logging. For example: -XX:+PrintGCDetails -XX:+PrintGCTimeStamps |
| Extra Executor Java Options | A string of extra JVM options to pass to executors. For instance, GC settings or other logging. For example: -XX:+PrintGCDetails -XX:+PrintGCTimeStamps |
| Extra Spark Submit Options | A string with –conf option for passing all the above configuration to a spark application. For example: –conf ‘spark.executor.extraJavaOptions=-Dconfig.resource=app’ –conf ‘spark.driver.extraJavaOptions=-Dconfig.resource=app’ In case of imported pipelines to verify the added property (java or spark) on pipeline configuration, please refresh the pipeline from tiles button to verify the updated pipeline configurations that are available post cluster configuration. |
| Environment Params | This option lets user add more parameter related to execution Environment. |
Notes:
When you create a pipeline, the associated or used schema is saved as metadata under message configuration.
Components are batch and streaming.
Likewise, in Spark standalone the application cores must be greater than or equal to the executor cores.
Error Handler Configuration
Error handler configuration feature enables you to handle the pipeline errors.
Error log target are of three types: RabbitMQ, Kafka and Logger.
Error Handler helps you to log pipeline errors to logger file or on Kafka or RMQ. You can refer the log file or message queues to view those errors whenever required.
All these errors will be visible on graphs under Summary view of pipelines that comes under Application Errors Tab.
Gathr gives you an option to handle errors after your data pipeline is created. When you save a pipeline, specify whether you want to enable error handler or not.
Either Kafka or RMQ is selected as an error log target.
Whenever an error happens, the pipeline will log the errors to the configured error handler.
By default, errors will always be published to log files.
If you want to disable logging errors to these queues, disable error handler while saving or updating actions on the pipeline.
If error handler is disabled, error graphs will not be visible and errors will not be available on the errors listing page.
If you disable error handler, then the error monitoring graphs will not be visible.
For DQM processor it is mandatory to keep this flag checked to use the Send to Error Feature.
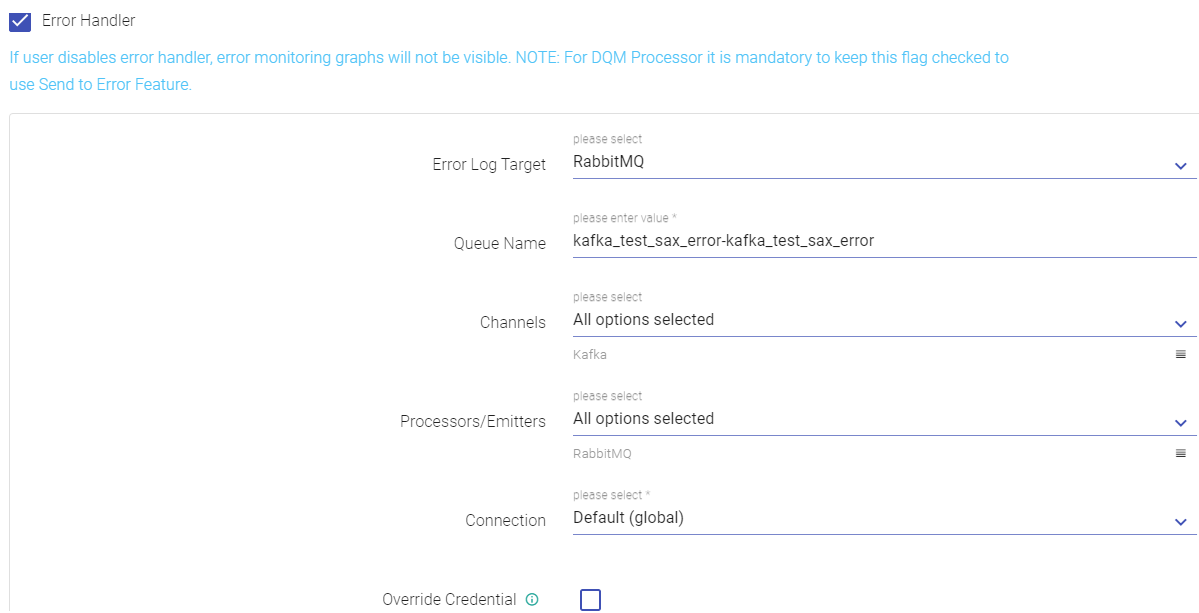
| Field | Description |
|---|---|
| Error Log Target | Select the target where you want to move the data that failed to process in the pipeline. If you select RabbitMQ, following tabs appear. |
| Queue Name | Name of the RabbitMQ Queue, where error to be published in case of exception. |
| Select Data Sources | Error handler will be configured against the selected Data Source. |
| Select Processors/Emitters | Error handler will be configured against the selected processor/emitters. |
| Connection | Select the connection where failed data would be pushed. |
| Enable TTL | TTL Value discards messages from RabbitMQ Error Queue, expected value is in minutes. |
| Back to Definition | Toggle back to the pipeline definition screen. |
| Apply Configuration | Toggle back to the Pipeline definition screen after saving the Error handler configurations. |
| Pipeline Status Alert | You will receive an alert if pipeline gets stuck while starting. |
Based on error handler target, you will be asked for target specific configurations like connection name, partitions and topic administration in case of Kafka and ttl in case of RabbitMQ.
| Field | Description |
|---|---|
| Error Log Target | If you select Kafka, then the following tabs appear. |
| Topic Name | Name of the Kafka Topic where error is to be published in case of exception. |
| Select Data Sources | Error handler will be configured against the selected Data Source. |
| Select Processors/Emitters | Error handler will be configured against the selected processor/emitters. |
| Connection | Select the connection where failed data would be pushed. |
| Partition | Number of partitions on the topic. |
| Replication Factor | The replication counts of the topic. |
| Field | Description |
|---|---|
| Error Log Target | If you select Logger, the following tabs appear. |
| Select Data Sources | Logger is configured against the selected Data Source. |
| Select Processors/Emitters | Logger is configured against the selected processor/emitters. |
Once you save or update the pipeline, and start the pipeline, you can view errors in the configured queue or topic as well as in pipeline logs.
For viewing error graphs, go to the Data pipeline tab on Data Pipeline Home page, click on the three dots of the pipeline tile and click on View Summary.
Status Alert Configuration
Upon enabling the Status Alert option, you can send Alert/Message to a Kafka Topic for any change in the pipeline status.
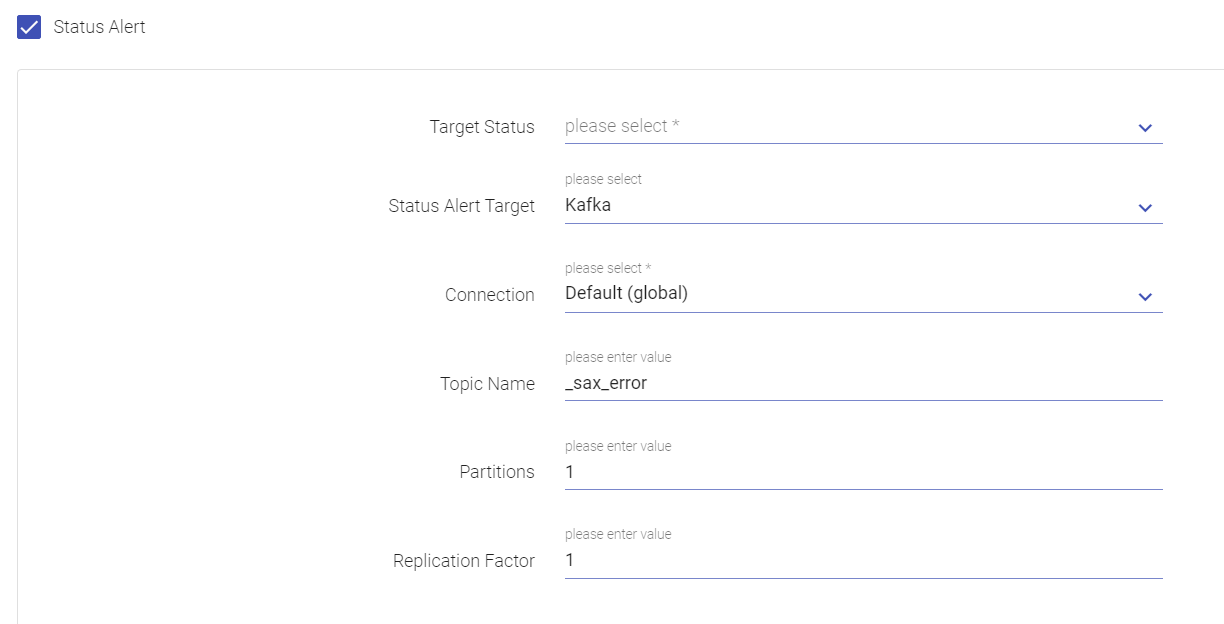
| Field | Description |
|---|---|
| Target Status | An alert will be triggered whenever status of the pipeline gets updated to Active, Starting, Stopped or Error as per the selection(s) made in Target Status field. |
| Status Alert Target | By default, the Kafka component is supported as a target for status alerts. |
| Connection | Select a connection name from the list of saved connections from the drop-down. To know more about creating connections, see Create Connections. |
| Topic Name | Enter a Kafka topic on which alert/message should be sent. |
| Partitions | Enter the number of partitions to be made in the Kafka Topic. |
| Replication Factor | Number of replications to be created for the Kafka topic for stronger durability and higher availability. |
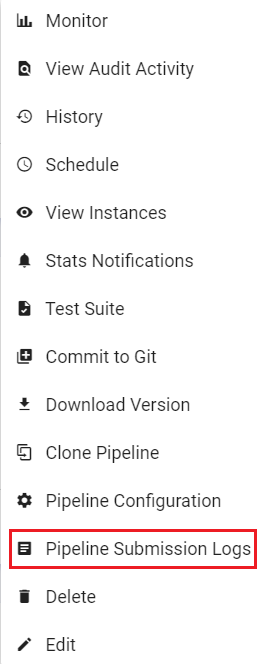
Actions on Pipeline
To view the screen, go to the home page of Data pipeline and click on the ellipses of a pipeline’s widget.
The following actions can be performed on a pipeline.
| Action | Description |
|---|---|
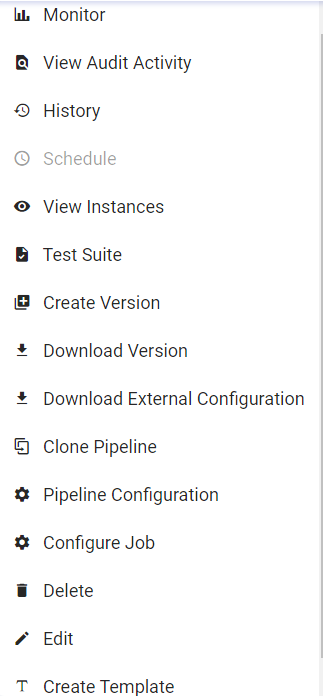
| Monitor | This feature enables you to Monitor error metrics of a pipeline and the error search tab allows you to search errors using keywords and filters. |
| View Audit Activity | This feature allows you to view the audit activities performed on the Pipeline. |
| History | This feature enables you to view the pipeline details i.e. start time, end time, status and the application id. |
Lag Notification
In a pipeline, if a Kafka data source is used and all the components are configured, then the Lag Notification option is available on the pipeline tile. The configuration details of Lag Notification option are mentioned below:
| Enable | Click the check box to enable the Lag Notification scheduler. |
| Email ID’s | Provide the email id(s) on which you want to be notified for the lag. |
| Frequency | Provide the scheduler frequency to check the Kafka lag. |
| Threshold | Provide the Kafka lag threshold value. |
| Email Notification Type | Select the preferred email notification type from the below options available: - Scheduled: Upon selecting Scheduled option as email notification type, the user will be notified via. an email as per the set frequency. - Threshold Breach: Upon selecting this option, the user will be notified in case a threshold breach in Kafka lag occurs. |
| View Instances | Option to view instances that are created within the pipeline. |
| Test Suite | Test Suite is a collection of Test Cases associated with the pipeline. |
| Create Version | Allows you to create a version of the pipeline while updating or from the pipeline listing page using pipeline ellipsis. This option is available when Version Control under SETUP is selected as Gathr Metastore. |
| Download Version | Download a version of the pipeline. |
| Download External Configuration | The user can download external configuration. |
| Delete | Delete the pipeline. |
| Clone Pipeline | User can clone a pipeline by selecting this option. |
| Pipeline Configuration | User can custom configure the pipeline. For details read topic. |
Pipeline Configuration
Upon clicking the pipeline tile’s ellipses, click Pipeline Configuration option. The pipeline definition window opens.
You have option to provide pipeline definition details including Log Level, Yarn Queue.
You can also Enable Resource Analyzer, select option to provide Status Alert, Enable Monitoring Graph, and check the option to Auto Restart on Failure including more properties such as Error Handler Configuration and Override Credential.
Once the pipeline definition details are provided, click Update.
Option to provide details for Schema Change Alert are available under the Schema Change Alert tab.
Schema Change Alert
During the inspect of these pipelines, if there is any change in the schema detection, for.e.g., additional columns detected in the .csv file while inspecting the pipeline; in such a scenario the user will be notified with the schema change alert. This option is available for the data sources mentioned below:
Kafka, Kinesis, S3, S3 Batch, JDBC, HDFS and HDFS Batch.
This option is also available for the following processors:
JSON processor, XML processor, field splitter processor.
The configuration details are mentioned below:
| Enable Schema Change Alert | Click the check box to enable this option. |
| Interval | Provide value for interval time in minutes/hours. This option will be visible for streaming channel/processor alone and in case of batch channel this option will not be available as the schema detection will be done during pipeline execution. |
| Minimum records to check | Provide a value for minimum records that are to be checked. |
| Timeout | Provide value for the time-out duration to achieve minimum records in seconds/minutes/hours. |
| Email ID | Provide email id on which the user wants to be notified. In case this field is not filled, the user will be notified on the email id of workspace user. |
| Configure Job | Configure Cluster (Databricks or EMR) and Deployment option. |
The Configure Job option (Cluster for Databricks) is explained below:
| Cluster Policy | Option to select the cluster policy created in Databricks to configure cluster that defines limits on the attributes available during the cluster creation. Default value is unrestricted. User have an option to download the cluster policy in the local system. |
| Cluster Type | Options to select a new cluster or an interactive cluster. If New Cluster option is selected, then provide the details for below fields: |
| Cluster Mode | Select the preferred cluster mode. The available options are: Single Node and Standard. If the user selects Single Node, then provide details for the below fields: - Databricks Runtime version - Node Type. Choose the node type from the drop-down list. |
If Standard option is selected as Cluster Mode, then provide details for the below fields:
| Databricks Runtime Version | Select the Databricks Runtime Version. Databricks Runtime is a set of core components that run on the clusters managed by Databricks. |
| Worker Type | Select the Worker Type from the drop-down list. Option to select the existing interactive cluster with Pools or create a new cluster with Pools while configuring the job. |
| Enable Auto-Scaling | Check the option to enable auto-scaling between minimum and maximum number of nodes based on load. |
| Workers | If the Enable Auto-Scaling option is unchecked, provide the value for Workers. |
| Spot Instances | Check this option to enable spot instances. Worker nodes are considered as Spot Instances based on availability. The driver node will always be on demand. On-demand instances will be deployed to replace any evicted spot instances due to unavailability. |
| Driver Type | Select the Driver Type from the drop-down list. If the Driver Type option is selected as Pool, then the Worker Type must also be Pool. Once the created cluster is associated with the pool and the cluster is created successfully, the pool can be utilized in configuring a job. |
If the Cluster Type is selected as Interactive Cluster, then provide the below fields:
| Select Cluster | Choose the preferred cluster from the drop-down list. - Upon selecting the cluster from the existing cluster list, the Cluster mode, Databricks Runtime Version, and Node Type of the selected cluster will get reflected. - Databricks cluster will be created with default Python 3. |
| Create Template | Option to create a template from the existing pipeline. Note: All the components of the pipeline must be configured in order to create a template. |
| Edit | Edit the pipeline. |
| Start/Stop Pipelines | To start and stop the pipeline. |
| Schedule | You can schedule a Batch Data Pipeline in fixed intervals through this option. The pipeline can be scheduled by using two options: - Normal Scheduler - Cron Scheduler See, Scheduling. |
| View Instances | You can create and view the existing instances of the pipeline. |
| Stats Notification | Statistics of the pipeline can be emailed with details. Explained below in detail. |
| Test Suite | Test Suite is a collection of Test Cases associated with the pipeline. |
| Commit to Git | Once the Git credentials are provided at the workspace level, you can create a pipeline version by selecting this option. |
| Download Version | Download a version of the pipeline. |
| Clone Pipeline | You can clone a pipeline by selecting this option. |
| Pipeline Configuration | Update the pipeline configuration. |
| Pipeline Submission Logs | Logs of Pipeline can be viewed by either clicking on Application ID or Pipeline Submission Logs. |
| Delete | Delete the pipeline. |
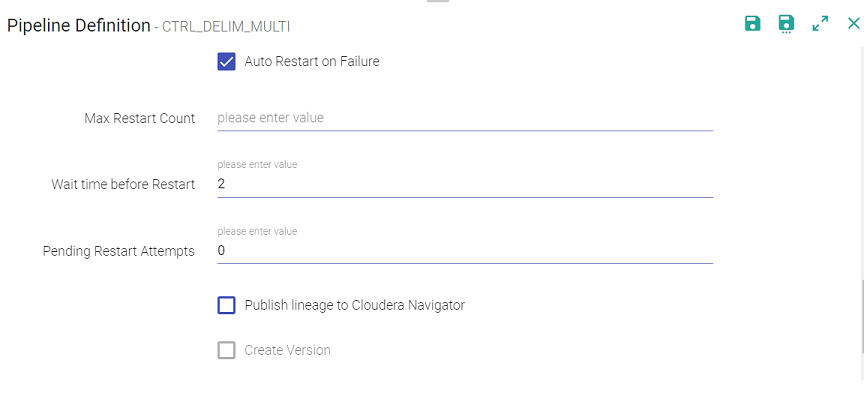
Auto Restart on Failure
| Action | Description |
|---|---|
| Max Restart Count | Upon check marking the Auto Restart on Failure option, you need to specify the number of maximum restart count of the pipeline (streaming), in case it fails to run. Each time a retry is triggered or gets failed an email notification is sent. |
| Wait Time Before Attempts | The amount of time (in minutes) i.e. the wait duration before the pipeline attempts to auto-restart is displayed here. |
| Pending Restart Attempts | The value for total number of pending restart attempts gets displayed here. |
| Publish lineage to Cloudera Navigator | Publish the pipeline to Cloudera environment. (Only if the environment is CDH enabled.) |
| Create Version | Creates new version for the pipeline. The current version is called the Working Copy and rest of the versions are numbers with n+1. This is in case Version Control System under Set Up is selected as Gathr Metastore. |
| Comment | Write notes specific to the pipeline. |
Upon clicking MORE PROPERTIES, further options appear within the Pipeline Configuration window. These are explained below:
MORE PROPERTIES
| Action | Description |
|---|---|
| Deployment Mode | Deployment Mode specifies the deployment mode of the pipeline. |
| Driver Cores | Number of cores to be used for the driver processes. |
| Driver Memory | Amount of memory to use for the driver processes. |
| Driver PermGen Size | Used to hold reflective data of the VM itself such as class objects and method objects. These reflective objects are allocated directly into the permanent generation, and it is sized independently from other generation. |
| Application Cores | Number of cores allocated to spark application. It must be more than the number of receivers in the pipeline. It also derives the number of executors for your pipeline. No. of executors = Application Cores/ Executor cores. |
| Executor Cores | Number of cores to be used on each executor. |
| Executor Memory | Amount of memory to be used per executor process. |
| Dynamic Allocation Enabled | When a pipeline is in running mode, the spark pipeline scale and scale down the number of executors at the runtime. (Only in case of CDH enabled environment). |
| Executor Instances | Enter value for executor instances. |
| Enable Resource Analyser | Enable to get insight for resource utilization of the pipeline. |
| Extra Driver Java Options | A string of extra JVM options to pass to the driver. For instance, GC settings or other logging. For example: -XX:+PrintGCDetails -XX:+PrintGCTimeStamps |
| Extra Executor Java Options | A string of extra JVM options to pass to executors. For instance, GC settings or other logging. For example: -XX:+PrintGCDetails -XX:+PrintGCTimeStamps |
| Extra Spark Submit Options | A string with –conf option for passing all the above configuration to a spark application. For example: –conf ‘spark.executor.extraJavaOptions=-Dconfig.resource=app’ –conf ‘spark.driver.extraJavaOptions=-Dconfig.resource=app’ |
| Environment Params | This option lets you add more parameters related to execution Environment. |
Click Update to save the details.
Pipeline Run History
You can view the details of pipeline by clicking the pipeline tile ellipses option. You can monitor the batch pipeline activity and keep a track of the run details for each instance such as the total number of records in input and output process and time taken by the pipeline to run completely. After the successful run of the pipeline, click the ellipses of the pipeline tile to view the batch monitoring history.
In the pipeline history page, you will be able to view the batch monitoring table and the run history of the pipeline with that table.
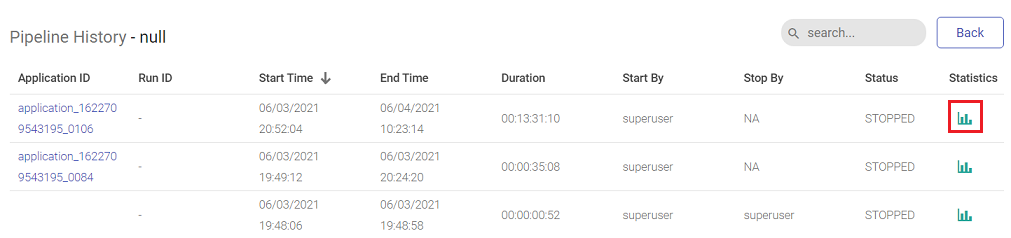
| Action | Description |
|---|---|
| Application ID | Application ID that was submitted to Spark. |
| Run ID | The unique Run ID of the pipeline. |
| Start Time | The beginning of the pipeline run. |
| End Time | The end time of the pipeline run. |
| Duration | The time it took for the pipeline to stop completely. |
| Start By | To begin/start the pipeline. |
| Stop By | To end/stop the pipeline. |
| Status | Reflects the current status (Run/start/stop/error) of the pipeline. |
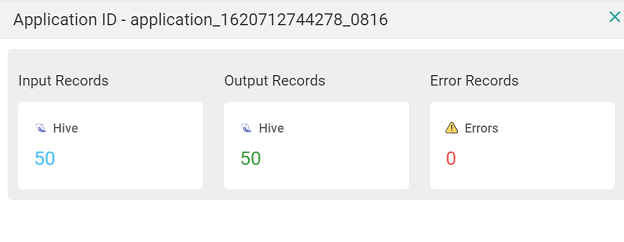
| Statistics | Click the summary icon under the statistics column to view the input/output records of the pipeline along with the connection details. |
Pipeline Submission Logs
The pipeline logs can either be viewed by clicking on application id or clicking on Pipeline Submission Logs option.
All the above Logs are also displayed under different color schemes.
Error Logs:
These logs are displayed in RED color.
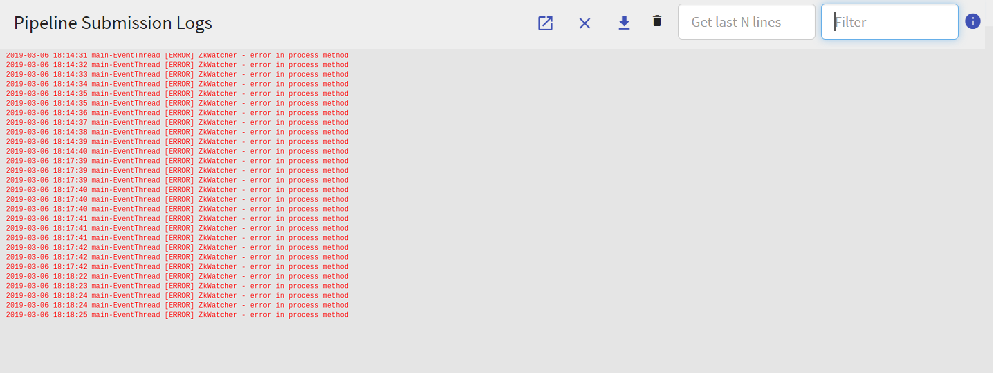
Warning Logs
These logs are displayed in ORANGE color.
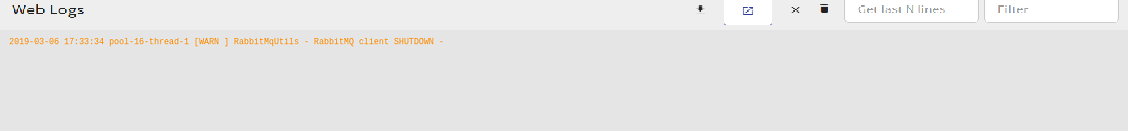
Rest of the logs
Rest of the logs are all displayed in Black color.
Two additional properties are added in Default Section on the Configuration page.
Tail Logs Server Port: Listening port number where tail command will listen incoming streams of logs, default is 9001.
Tail Logs Max Buffer Size: Maximum number of lines that can be stored on browser, default is 1000.
If you have any feedback on Gathr documentation, please email us!