Gathr is an enterprise grade, visual, data analytics platform for unified streaming and batch data processing based on best-of-breed open source technologies. It supports the end-to-end functionality of data ingestion, enrichment, machine learning, action triggers, and visualization. Gathr offers an intuitive drag-and-drop visual interface to build and operationalize data applications five to ten times faster, across industries, data formats, and use cases.
Supported Browsers:
l Google Chrome 74.0 and above
l Mac Safari 12.0.0 and above
l Firefox 66 and above
Note: Internet Explorer is not supported.
This topic helps the user to get familiarized with Gathr landing page. A user can login to Gathr application either as a Superuser or as a Workspace user based on the role(s) and permission(s) assigned.
A Superuser is responsible for monitoring and administration of Gathr.
The monitoring can be done with the help of Superuser dashboard and administration can be done with the help of the features which are displayed in the main menu.
Once the Superuser logs in, the Superuser Dashboard will be displayed which is the landing page.
Given below is the illustration of the landing page and the details of each component is explained further.
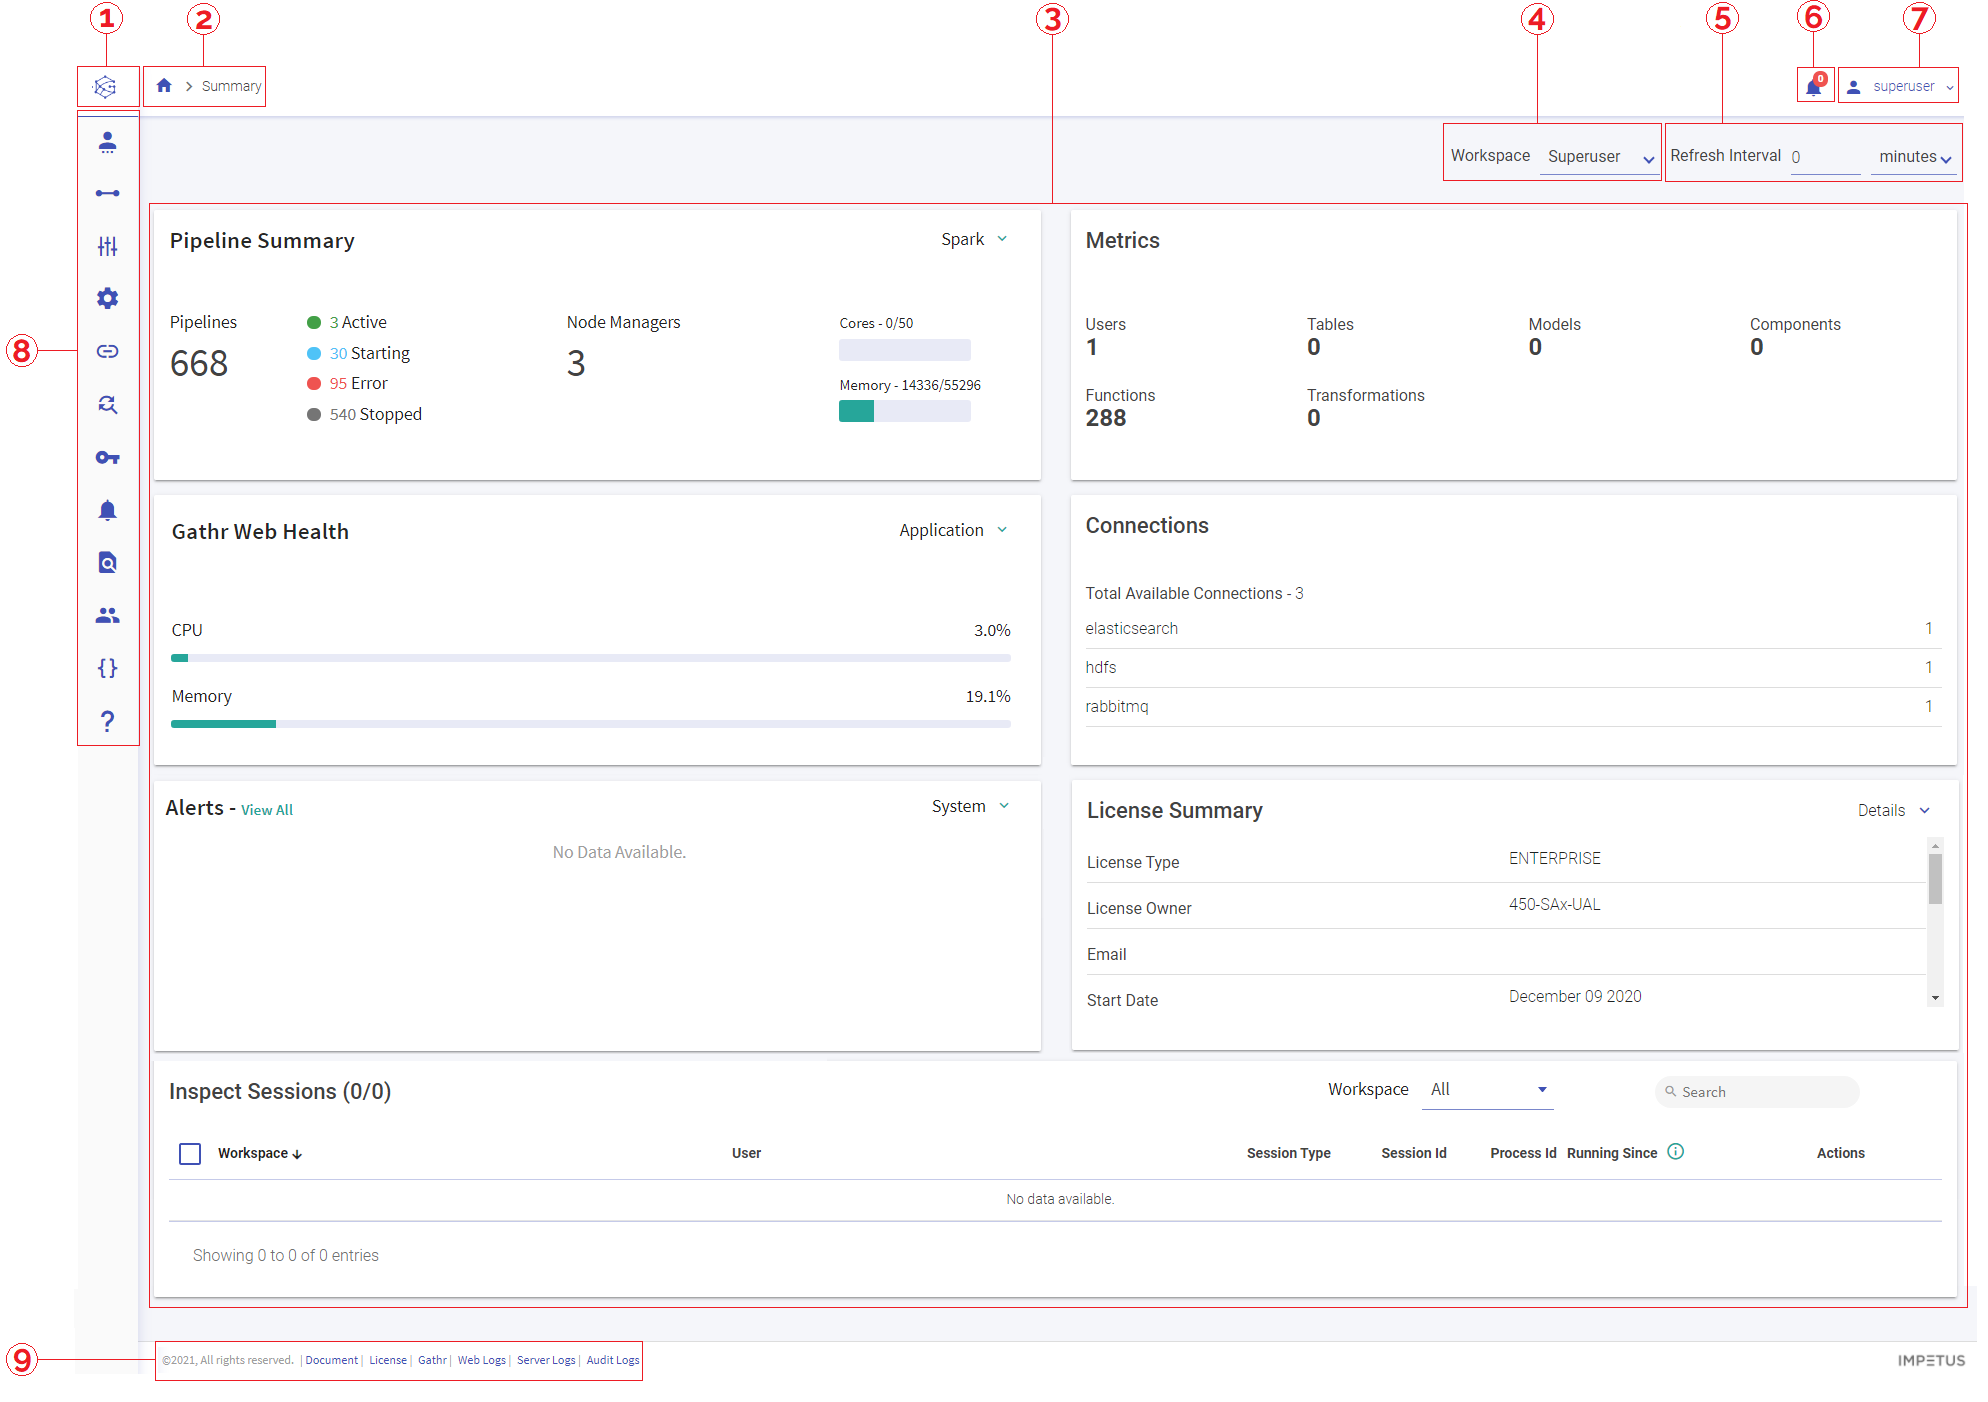
Illustration Number | Landing Page Components | Description |
|---|---|---|
1 | Gathr Logo | Logo of the Gathr product. |
2 | Summary | Name of the page that is displayed in the application. |
3 | Dashboard | Dashboard to monitor various features like Pipeline Summary, Metrics, StreamAnalytix Web Health, Connections, Alerts, License Summary and Inspect Sessions. |
4 | Workspace | A drop-down option for the Superuser to display the dashboard of either entire Gathr application or individual workspaces. |
5 | Refresh Interval | Refresh interval (in minutes or seconds) for the log monitoring. |
6 | Alerts | System alerts with a brief description and timestamp. |
7 | Superuser Settings | Options to manage the Superuser settings and option to logout of the application. |
8 | Gathr main menu | Side navigation panel in Gathr (main menu). |
9 | Gathr application footer | Links to Gathr Online Documentation, License details, Web Application Logs, Tomcat Catalina Logs and Audit Logs. |
The superuser dashboard consists of a combination of different widgets such as, Pipeline Summary, Metrics, StreamAnalytix Web Health, Connections, Alerts, License Summary and Inspect Sessions.
The Workspace dashboard also consists of all the widgets given above except Connections and License Summary. All the widgets that appear in the Workspace dashboard will contain relevant details specific to the Workspace alone.
This widget provides a summary of all the pipelines throughout the workspaces.
The below table describes the Pipeline Summary and its components:
Pipeline Summary | |
|---|---|
Pipelines | The number of pipelines created in Spark engine across all the workspaces. |
Active | Number of active pipelines across all workspaces. |
Starting | Number of pipelines in starting mode, across all workspaces. |
Error | Number of pipelines that are in error state, across all workspaces. |
Stopped | Number of pipeline that have stopped, across all workspaces. |
Node Managers | Number of node managers for the pipelines. |
Cores | Status of the allocated cores. |
Memory | Status of the allocated memory. |
Spark | Supported engine for Gathr application. |
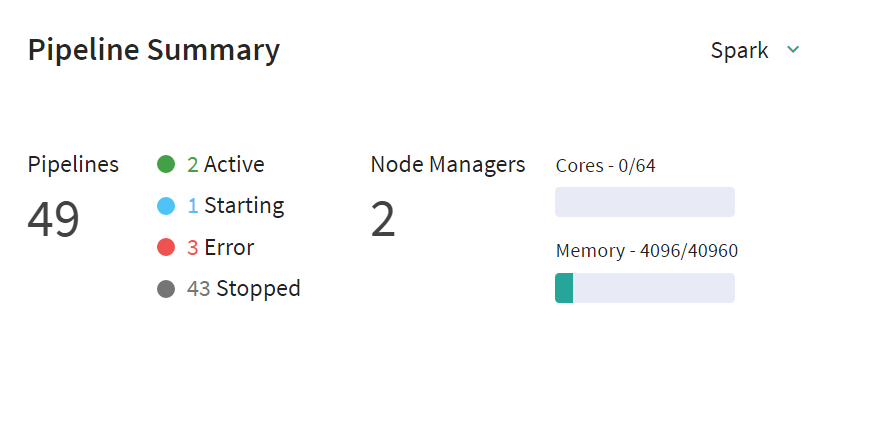
Metrics provides the count of different entities throughout the workspaces.
The below table describes the Metrics and its components:
Field | Description |
|---|---|
Users | Number of users across all workspaces. |
Tables | Number of tables across all workspaces. |
Models | Number of models registered across all workspaces. |
Components | Number of components across all workspaces. |
Functions | Number of functions (system and custom) registered within all the workspaces. |
Transformations | Total number of transformations created across all workspaces. |
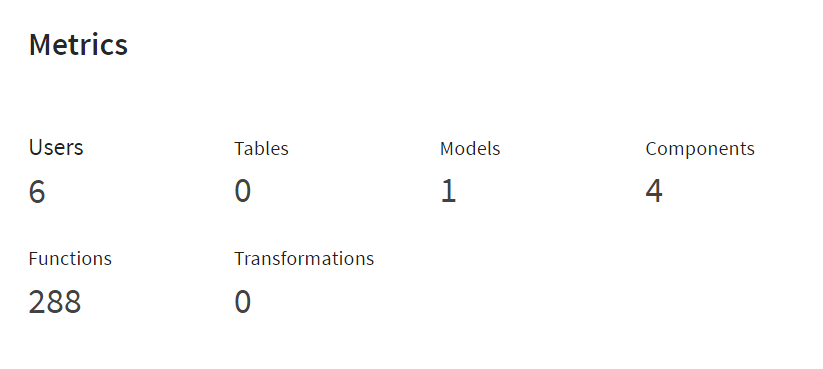
This section helps to monitor the overall health of the Gathr Web Application through the memory and CPU utilization.
Application Web Health shows the utilization of the CPU and Memory by the Gathr Application. Choose Application from the drop-down menu provided at the top right corner of the widget.
CPU
CPU shows the average use of all the cores available on machine (in percentage). CPU usage happens node by node. For example, there are 4 node managers on a machine and the Application used 2 nodes, that is 100% of one node and 90% of the other node. (As shown in the illustration above)
Memory
The total utilization of memory on machine (in percentage). That is the Application will use the total available memory irrespective of node.
This widget provides details about System Health. System Web Health is about the machine on which Gathr application is running.
CPU
The accumulative usage of all cores available on machine (in percentage) that is irrespective of CPU utilization of Gathr Application.
Memory
The total utilization of memory on machine (in percentage). This also is irrespective of the Application memory.
Connection is an end-point configuration for an infrastructure component. This widget provides the total number of connections available in Gathr i.e., total count of all the connections at Superuser level and all the Workspaces.
In the illustration below, each component type has a corresponding number to it, which signifies the number of different end-point configurations available.
Gathr can connect to infrastructure components like Cassandra, RabbitMQ, Elasticsearch, HDFS, Hbase, Kafka, Solr, and Hive.
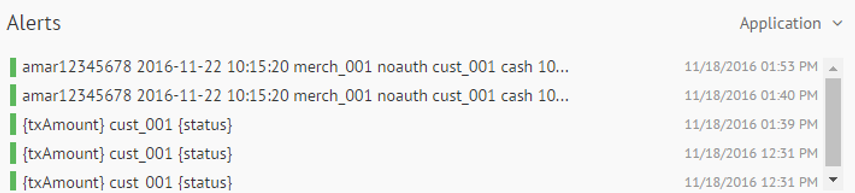
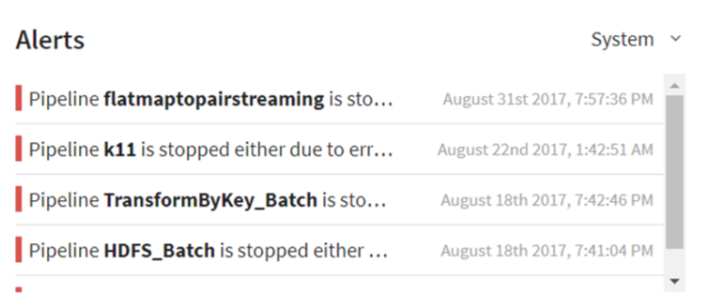
This widget will show system alerts, with a brief description and its timestamp. The user can also check the generated alerts on the UI along with email notifications.
On the Alerts widget, click the drop-down arrow and select Application/System.
On the Alerts widget, click the drop-down arrow and select Application. User can apply Alerts on a streaming pipeline as well. User will see the description of the alert and its time stamp in this widget. The alert can have a customized description.
This widget shows the alerts generated by a pipeline when it goes in error mode or terminated from YARN.
System alerts shows two types of alerts.
Pipeline stopped Alerts: Alerts thrown when a Pipeline is terminated from YARN.
Error Mode Alerts: Alerts thrown when the Pipeline goes in error mode.
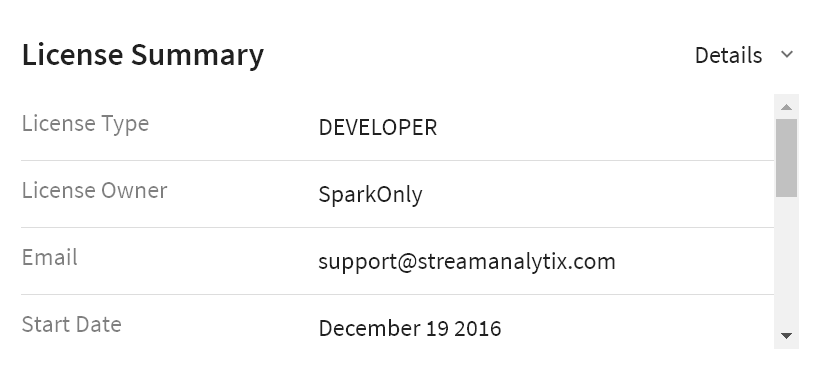
This is the summary of the license and the license owner:
Note: License type is dependent on the license validity.
License Validity
There are five types validity of a license:
Category | License Validity | Description |
|---|---|---|
A | Time-based | License cannot be used after the expiry date. It provides early warning alerts. |
B | Total no. of cores | License will not permit usage of any more than total number of cores. |
C | Total no. of Nodes and Cores | License is valid for a specific no. of nodes and specific no. of cores underlying each node. System will not permit usage of any more than the specified number of node or cores per node. For e.g., Like 2 nodes and 2 cores per node = 2nodes and 4 cores. Therefore, if you have 2 nodes but each node has 3 cores, the license will not be valid. |
Any single installation of Gathr will support only one of the following license types:
1. A
2. B
3. C
4. A and B
5. A and C
The user can also find the same information on the bottom left corner of the dashboard page by clicking on License.
Supported modules are the supported engine, Spark
Property | Description |
License Type | The license types are Enterprise, Developer and Trial. |
License owner | Name of the license owner. |
Email id of the license owner. | |
Start date | Start date of the license duration. |
Expiration date | Expiration date is the end date of the license duration. |
Supported Engines | The supported processing engine. |
Max Cores | Max Cores are number of cores allowed by the license. |
Max Nodes | Max Nodes are number of nodes allowed by license. |
Cores/Node | Cores/Node are maximum number of codes allowed per node. |
Version | The release version of Gathr. |
If duration is to be extended the license owner can contact:
You will get an alert 14 day before the expiry date, both email and periodic notifications on Gathr UI.
Violation
There are three codes available that shows the status of the license. Violation tab is at the top right corner of the widget.
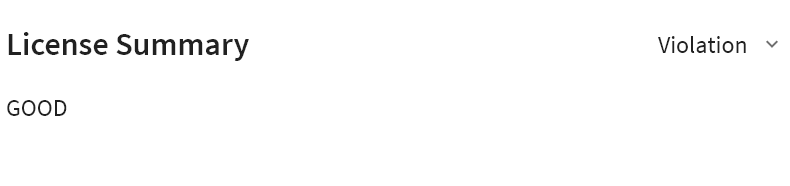
GOOD - License not expired and not violated.
Expired - License expired.
Violated - License in violated state.
In case of expired or violated license, contact Gathr support team at:
All the running Inspect sessions are listed in this widget.
All the users in all of the workspaces of the superuser can be viewed with the details explained below.
These inspect sessions can be filtered on the basis of
l Workspace
l Session Type: Local
You can view live streaming of logs corresponding to a local session and download logs.
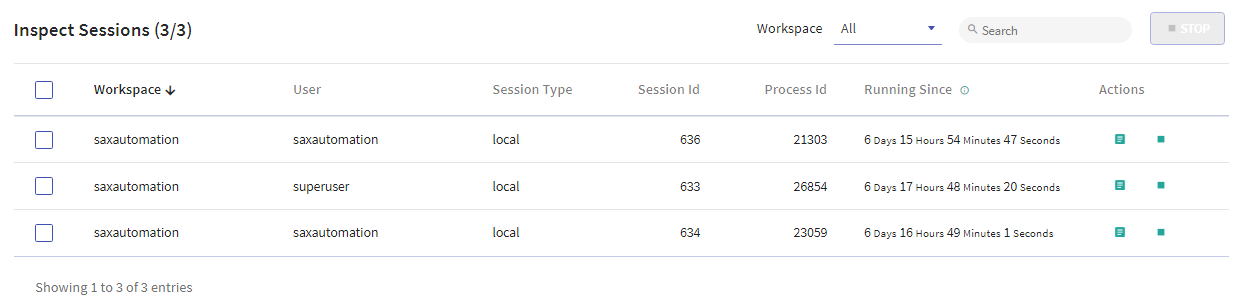
The functionality of each tab is shown below:
Field | Description |
|---|---|
Workspace | The name of the workspace under the superuser for which the inspect session was created. |
User | The name of the user under the workspace for which the inspect session was created. |
Session Type | Session type: Local. |
Session ID | The ID number of the inspect session. |
Process ID | The Process ID number of the inspect session. |
Running Since | The duration of the inspect session in hours/minutes and seconds. |
Actions | Logs: View inspect session logs, download and delete. Stop: Stop the inspect session. |
Superuser can stop active session(s) of workspace(s) by using the stop button.
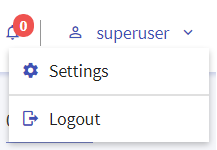
Go to Superuser on the top right corner of the superuser landing page and click on Settings.
Superuser can access settings with this option and also has a provision to logout of Gathr.
Under superuser settings you can change the password and regenerate token value. Regenerate token helps in regenerating the token in case the previous token expires. Success message is displayed when the superuser updates the token value.
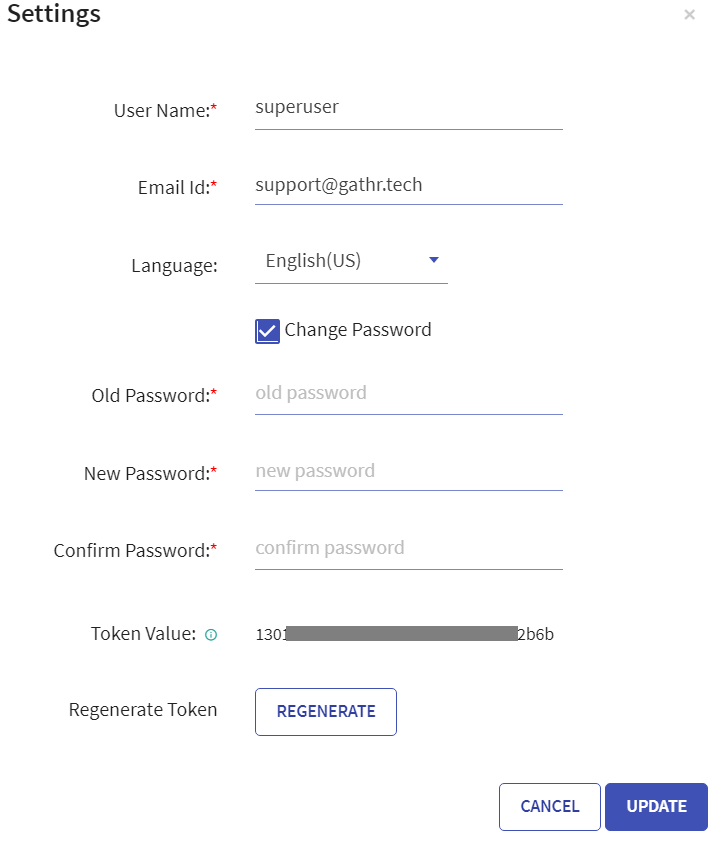
Superuser Settings | |
|---|---|
Field | Description |
User Name | Superuser name of the Gathr application. |
Email Id | Superuser’s email id to receive notifications. |
Language | Superuser’s choice of Language. English (US) by default. |
Change Password | Checkbox option to change the existing password. Note: Once the checkbox option is selected to change password, three additional fields appear in the settings i.e, Old Password, New Password and Confirm Password. |
Token Value | Generated token value. |
Regenerate Token | Generate token without updating password. |
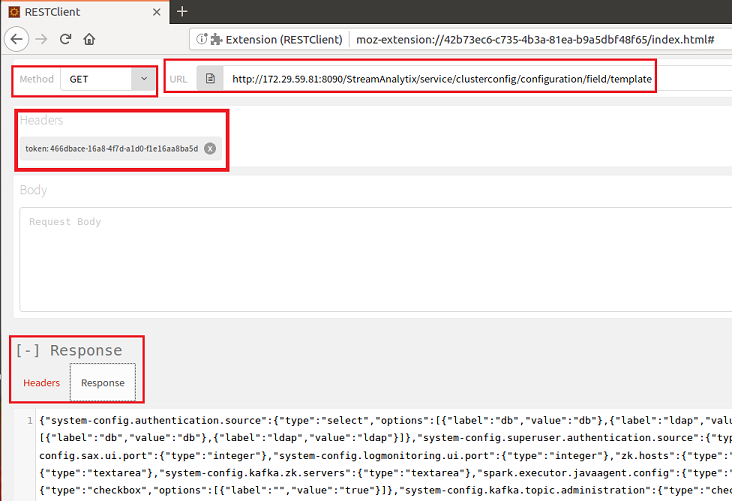
With the token value, superuser can perform actions such as workspace creation, viewing the cluster configuration directly through REST calls.
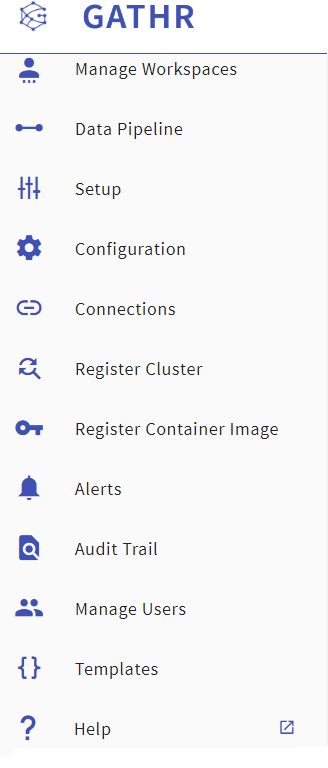
The main menu can be accessed from the left navigation panel and as explained earlier the Superuser can manage the Gathr administration with the help of features that are available in the main menu.
For more details on Gathr Administration, see Administration.
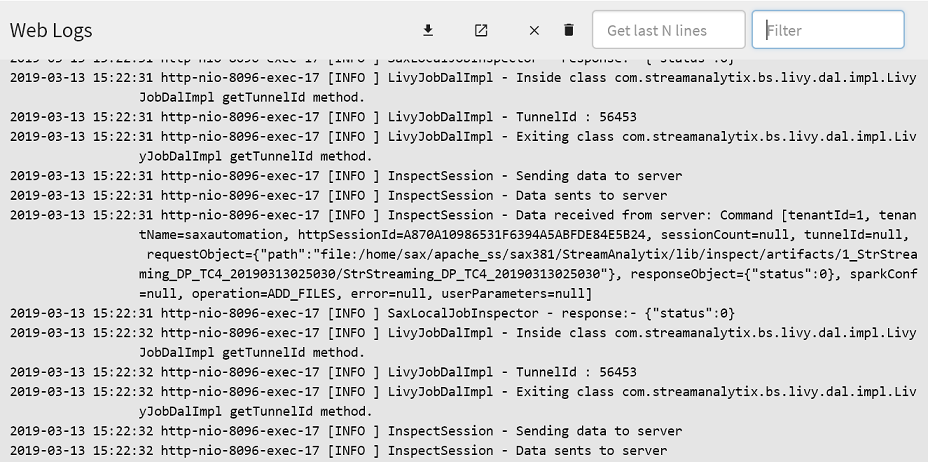
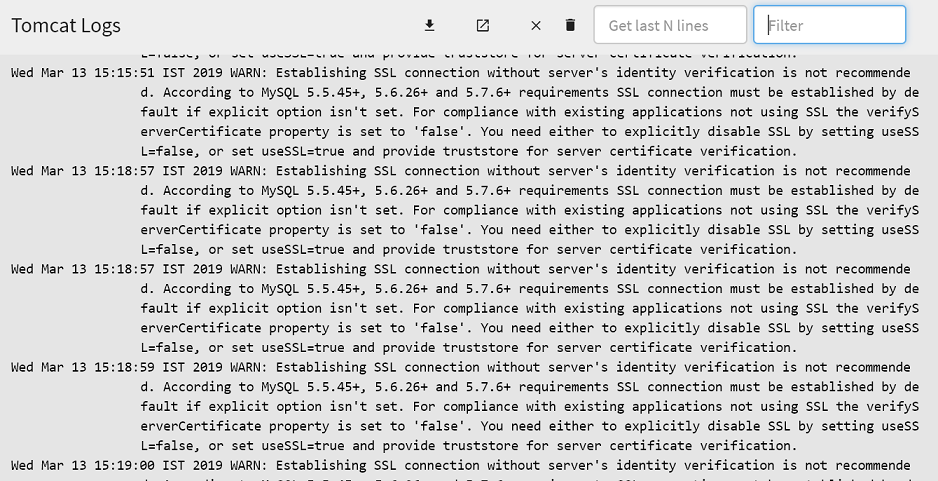
Live streaming of logs is available in Gathr so that you can debug issues from the browser itself without the need to access systems where Gathr Webstudio is running. The live logs available on the UI are mentioned below:
Application Logs can be viewed on the footer of the Gathr webpage as shown below:

l Web Logs
The other logs for local inspect sessions and data pipelines can be viewed on the relevant pages of the Gathr application as follows:
l To view the Local Inspect Session Logs, see Livy Connect window or Log button from the Inspect Sessions.
l To view the Data Pipeline related log details, see Pipeline Submission Logs.
Web logs can be viewed by clicking the Web Logs option found in the footer of Gathr application.
Tomcat Catalina logs can be viewed by clicking the Tomcat Logs option found in the footer of Gathr application.
Application Audit logs can be viewed by clicking the Audit Logs option found in the footer of Gathr application.
The logs are generated with timestamps. Available actions on logs are:
Field | Description |
|---|---|
Pin to another tab | The log window can be pinned to a new tab. |
Download | Download the logs.gz file. In case of Web Application logs, Gathr logs are provided and ten latest sax.log archived files (if available) and by clicking on it, it can be downloaded. |
Close window | Close the logs window. |
Delete logs | Delete the logs and clear the console. |
Get last N lines | By specifying the number of lines, last N log lines can be viewed. |
Filter | Apply a keyword filter. The filters are not case sensitive. |